
Heat map widget
A Heat Map widget compares a metric across two dimensions. It needs exactly two dimensions and one metric.
Colour intensity represents the metric value for each pair of dimension values: a darker colour means a greater value. The scale next to the chart shows which colour matches which value.
Colours make differences in the data much easier to see than numbers in a spreadsheet.
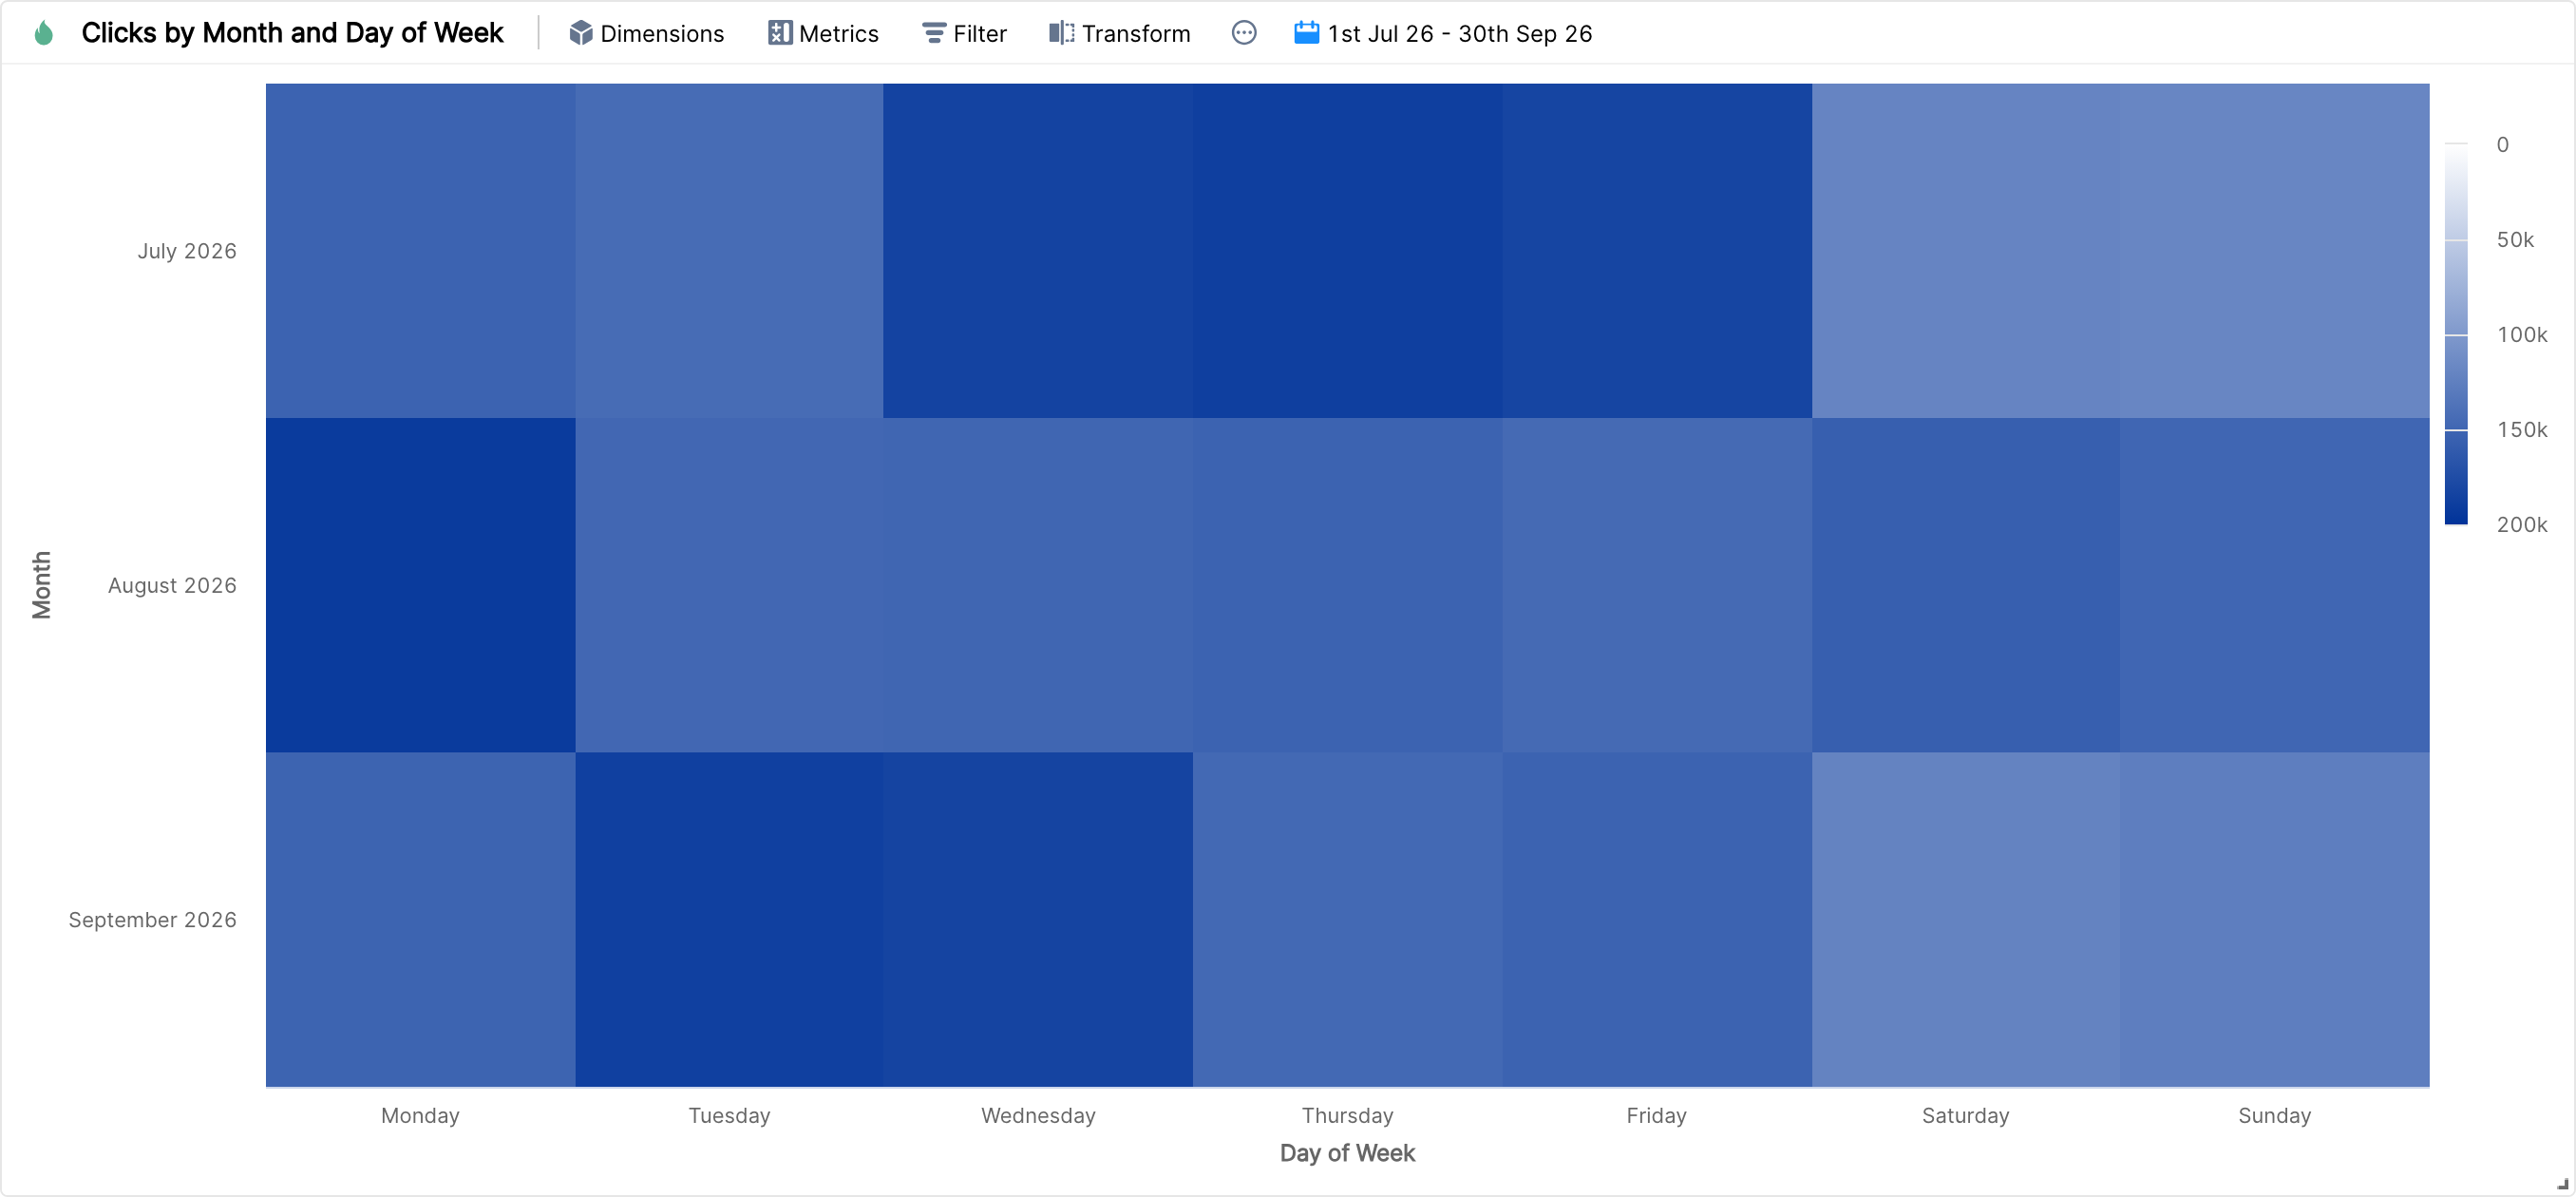
For example, the heat map above shows how clicks vary by day of the week across three months.