
Funnel chart widget
Funnel Chart
The Funnel Chart shows the progressive reduction of data as it passes from one phase to the next. In addition to metric values, you can add a breakdown to analyse how other dimensions contribute to the metric.
The drop in the vertical values shows the reduction in a breakdown value as it passes to the next phase.
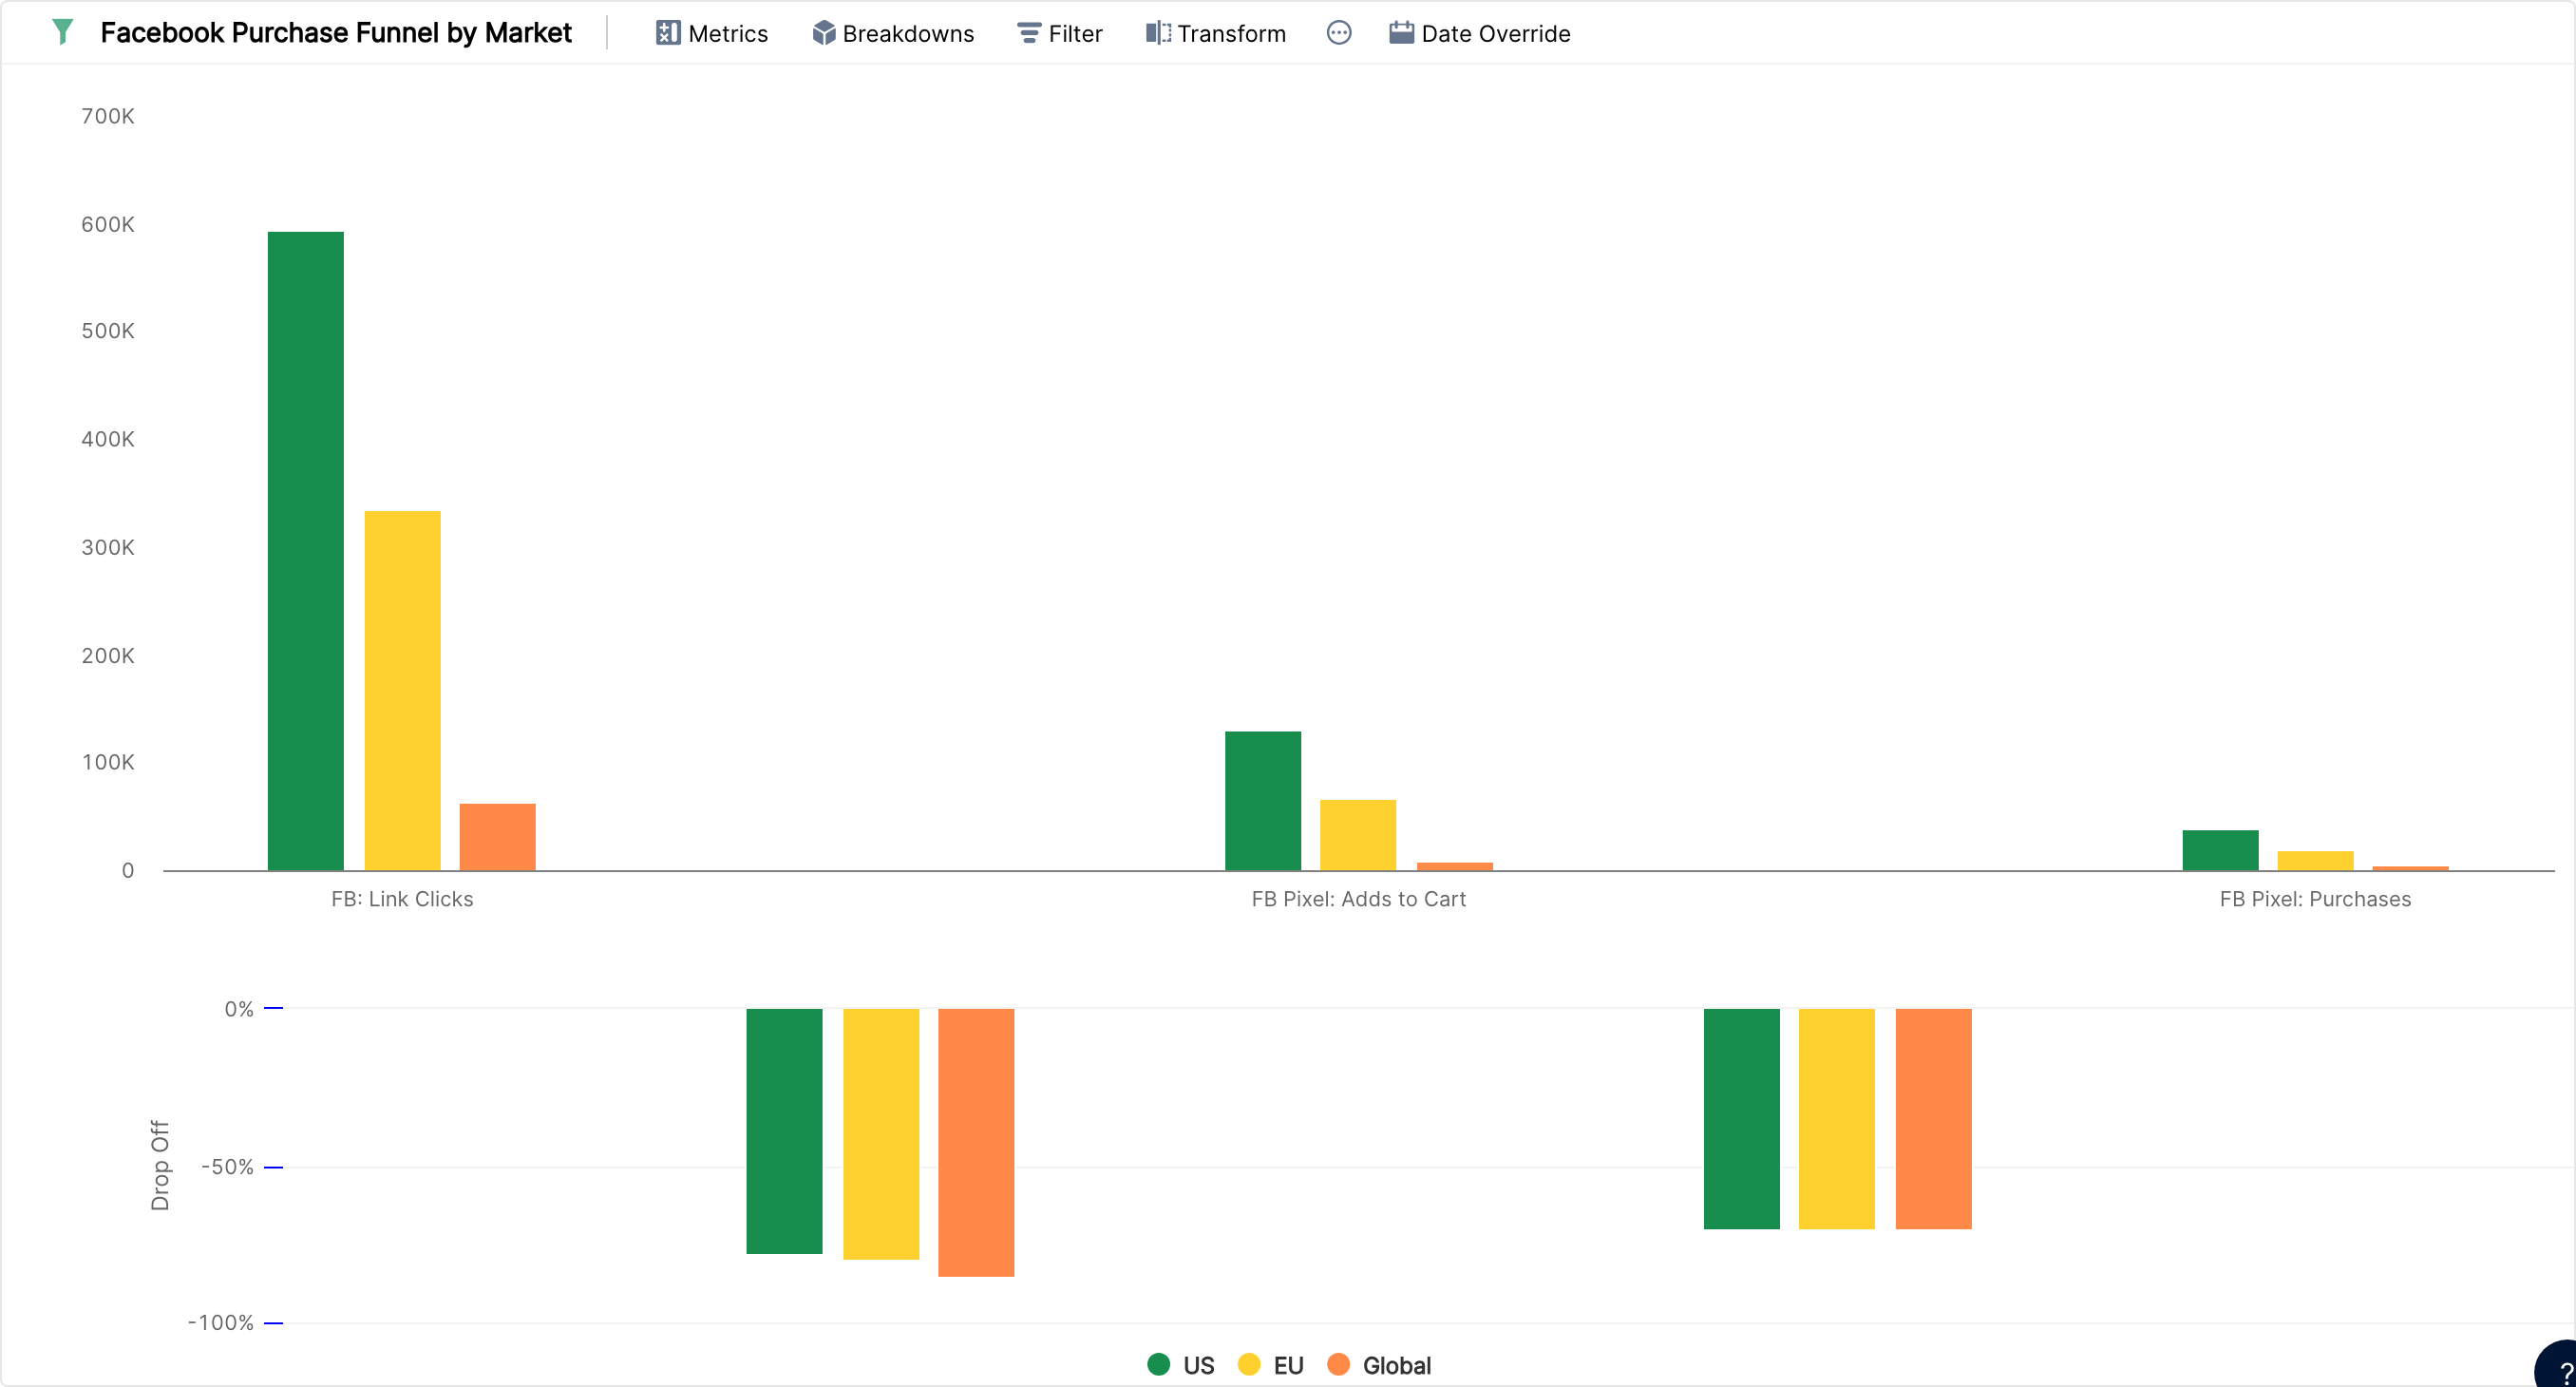
A funnel chart needs at least two metrics and allows one breakdown.
All metrics must be of the same type. For example, you can't mix numeric and currency metrics.
Labels are not available for this visualisation.
If you need more than one dimension, transform the funnel chart into a Column or Combo chart.