
Breaking down metric columns (metric breakdowns)
Metric breakdowns split the metric columns of a table into sub-columns, one for each value of a dimension. A table of funnel stages with Spend and ROAS broken down by Market shows Spend (US), Spend (EU), Spend (Global), ROAS (US) and so on, side by side.
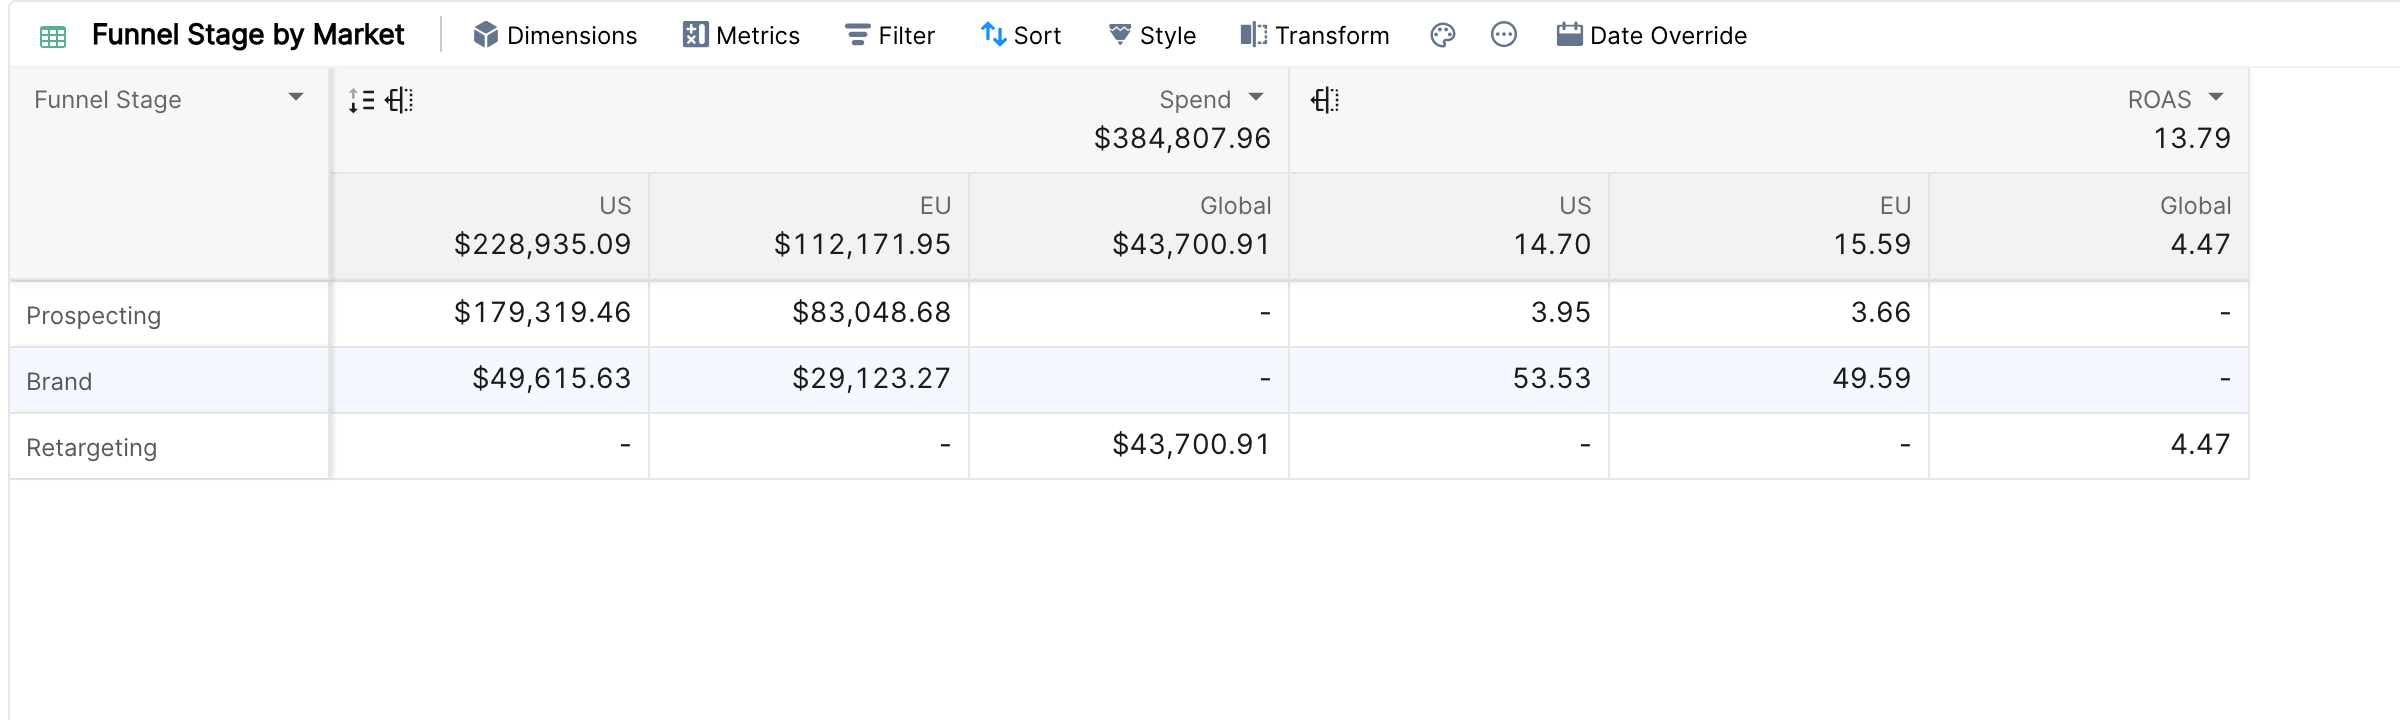
This gives you a pivot-style view with several metrics at once, while keeping all the table features: comparison, Share%, conditional formatting, trends and dimension breakdowns.
Note: metric breakdowns are not enabled for every account. If you don't see a Breakdowns section in the Metrics panel of a table, contact your account manager to enable it.
Adding a metric breakdown
In a table widget with at least one metric, click Metrics.
Click Breakdowns on the left, and pick the dimension to break down with on the right, for example Market.
Choose which values get their own column (see below).
Click Apply.
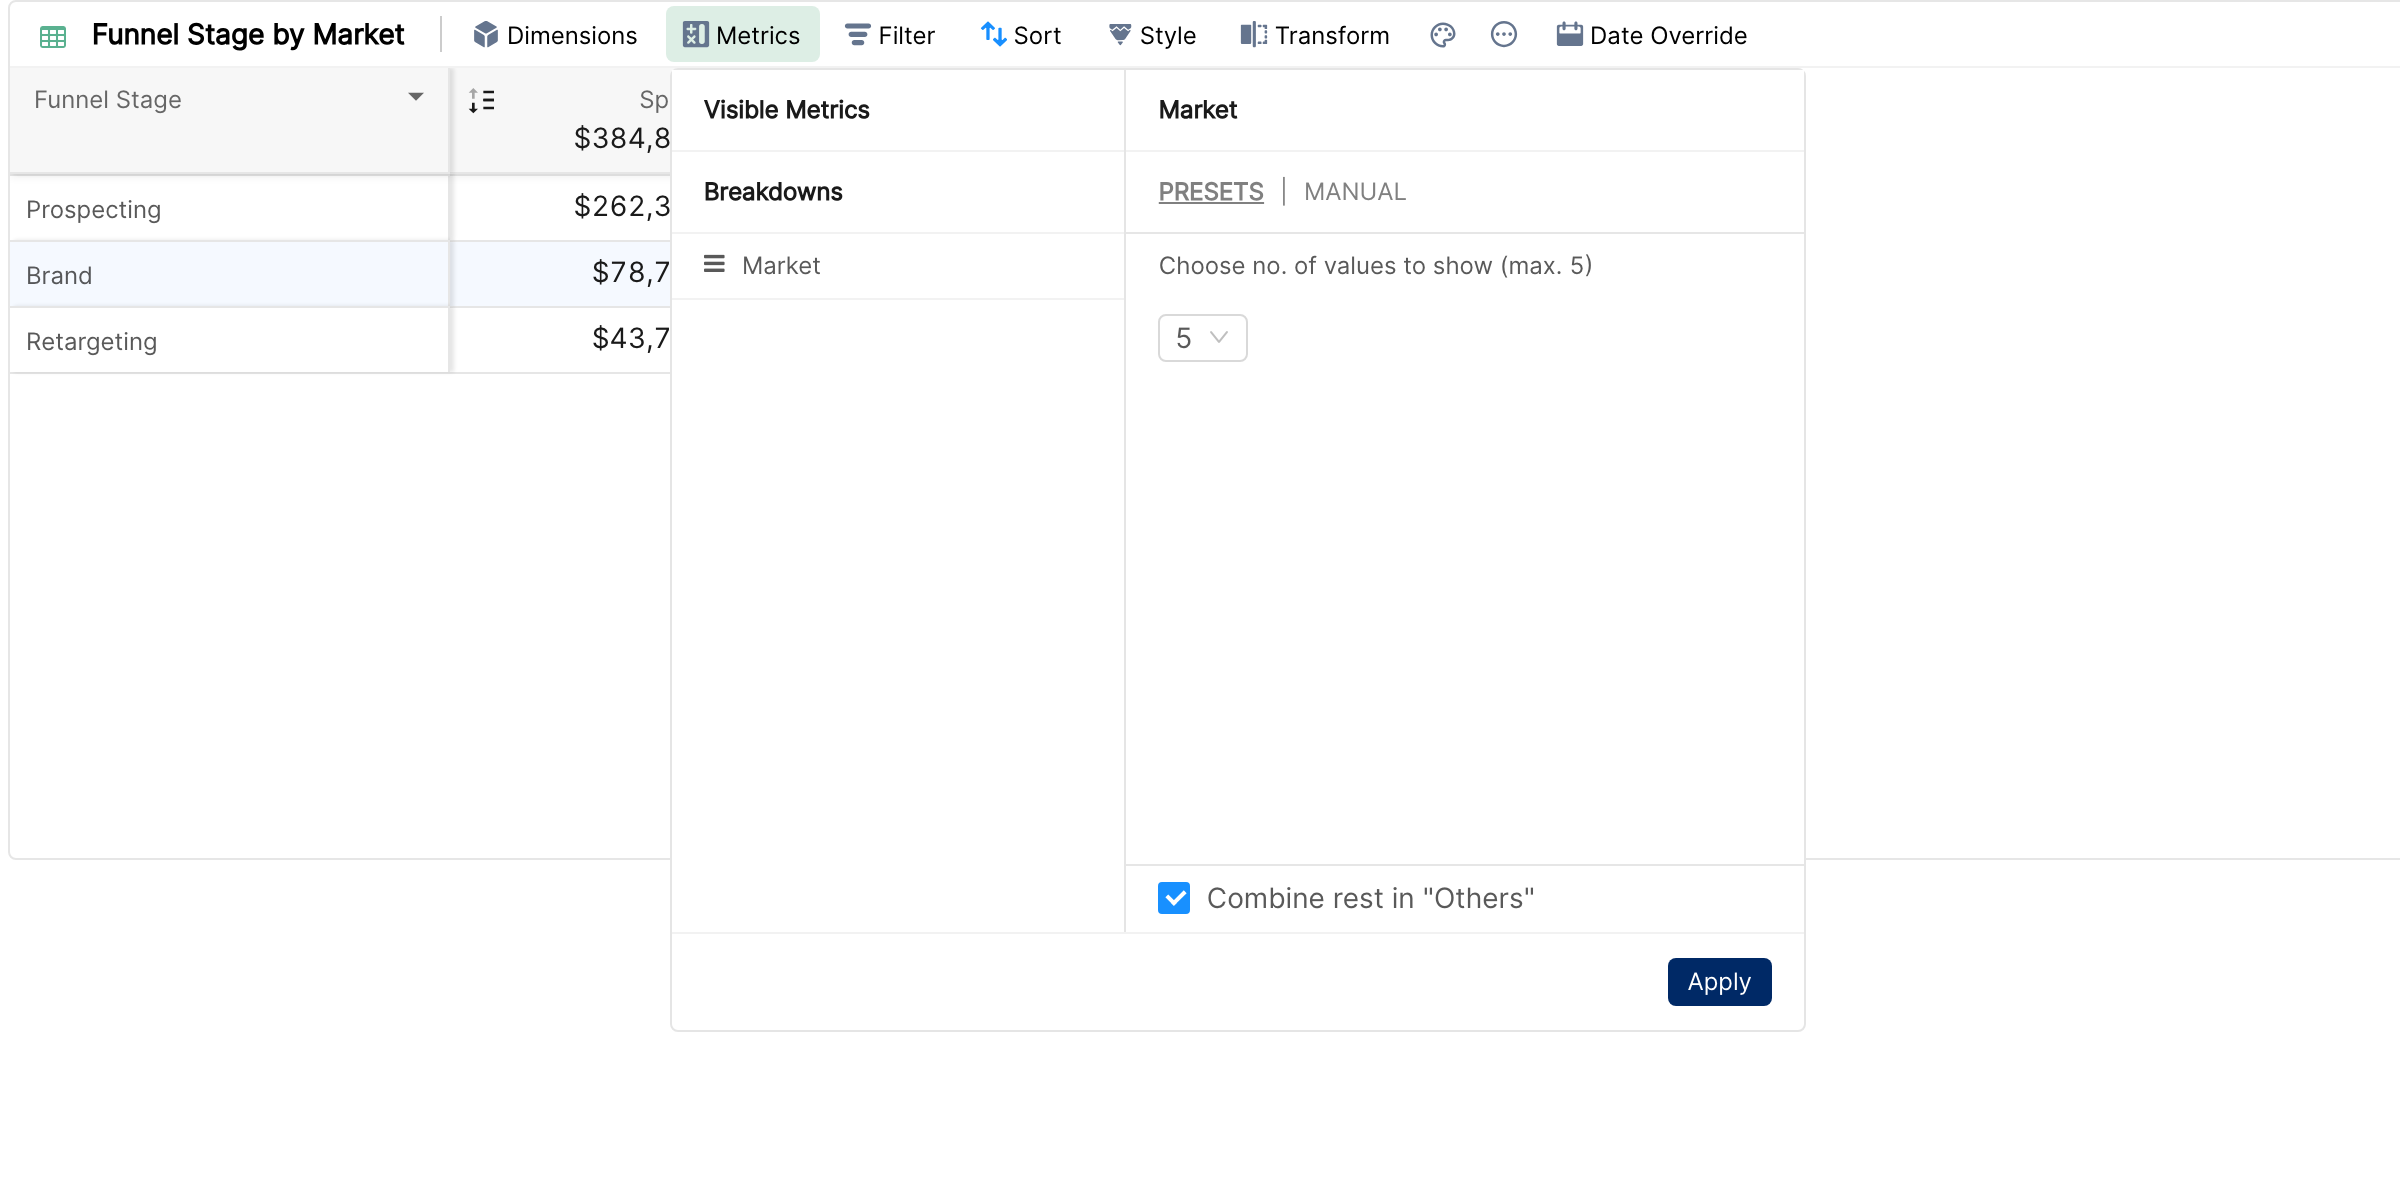
One breakdown applies to all the metrics in the table. Each metric header gets an icon to collapse its sub-columns into a single total column and expand them again.
Choosing which values get a column
Presets shows the top values. The maximum depends on the dimension:
Breakdown dimension | Values you can show |
Most dimensions (Market, Channel, Campaign and so on) | 2 to 5 |
Date, Day of Week, Day of Month | 2 to 7 |
Week, Week Number, Week of Year, Month, Month of Year | 2 to 6 |
Quarter | 2 to 4 |
Year | 2 to 3 |
Manual lets you search for and pick up to 5 specific values, for example the two markets you want to compare.
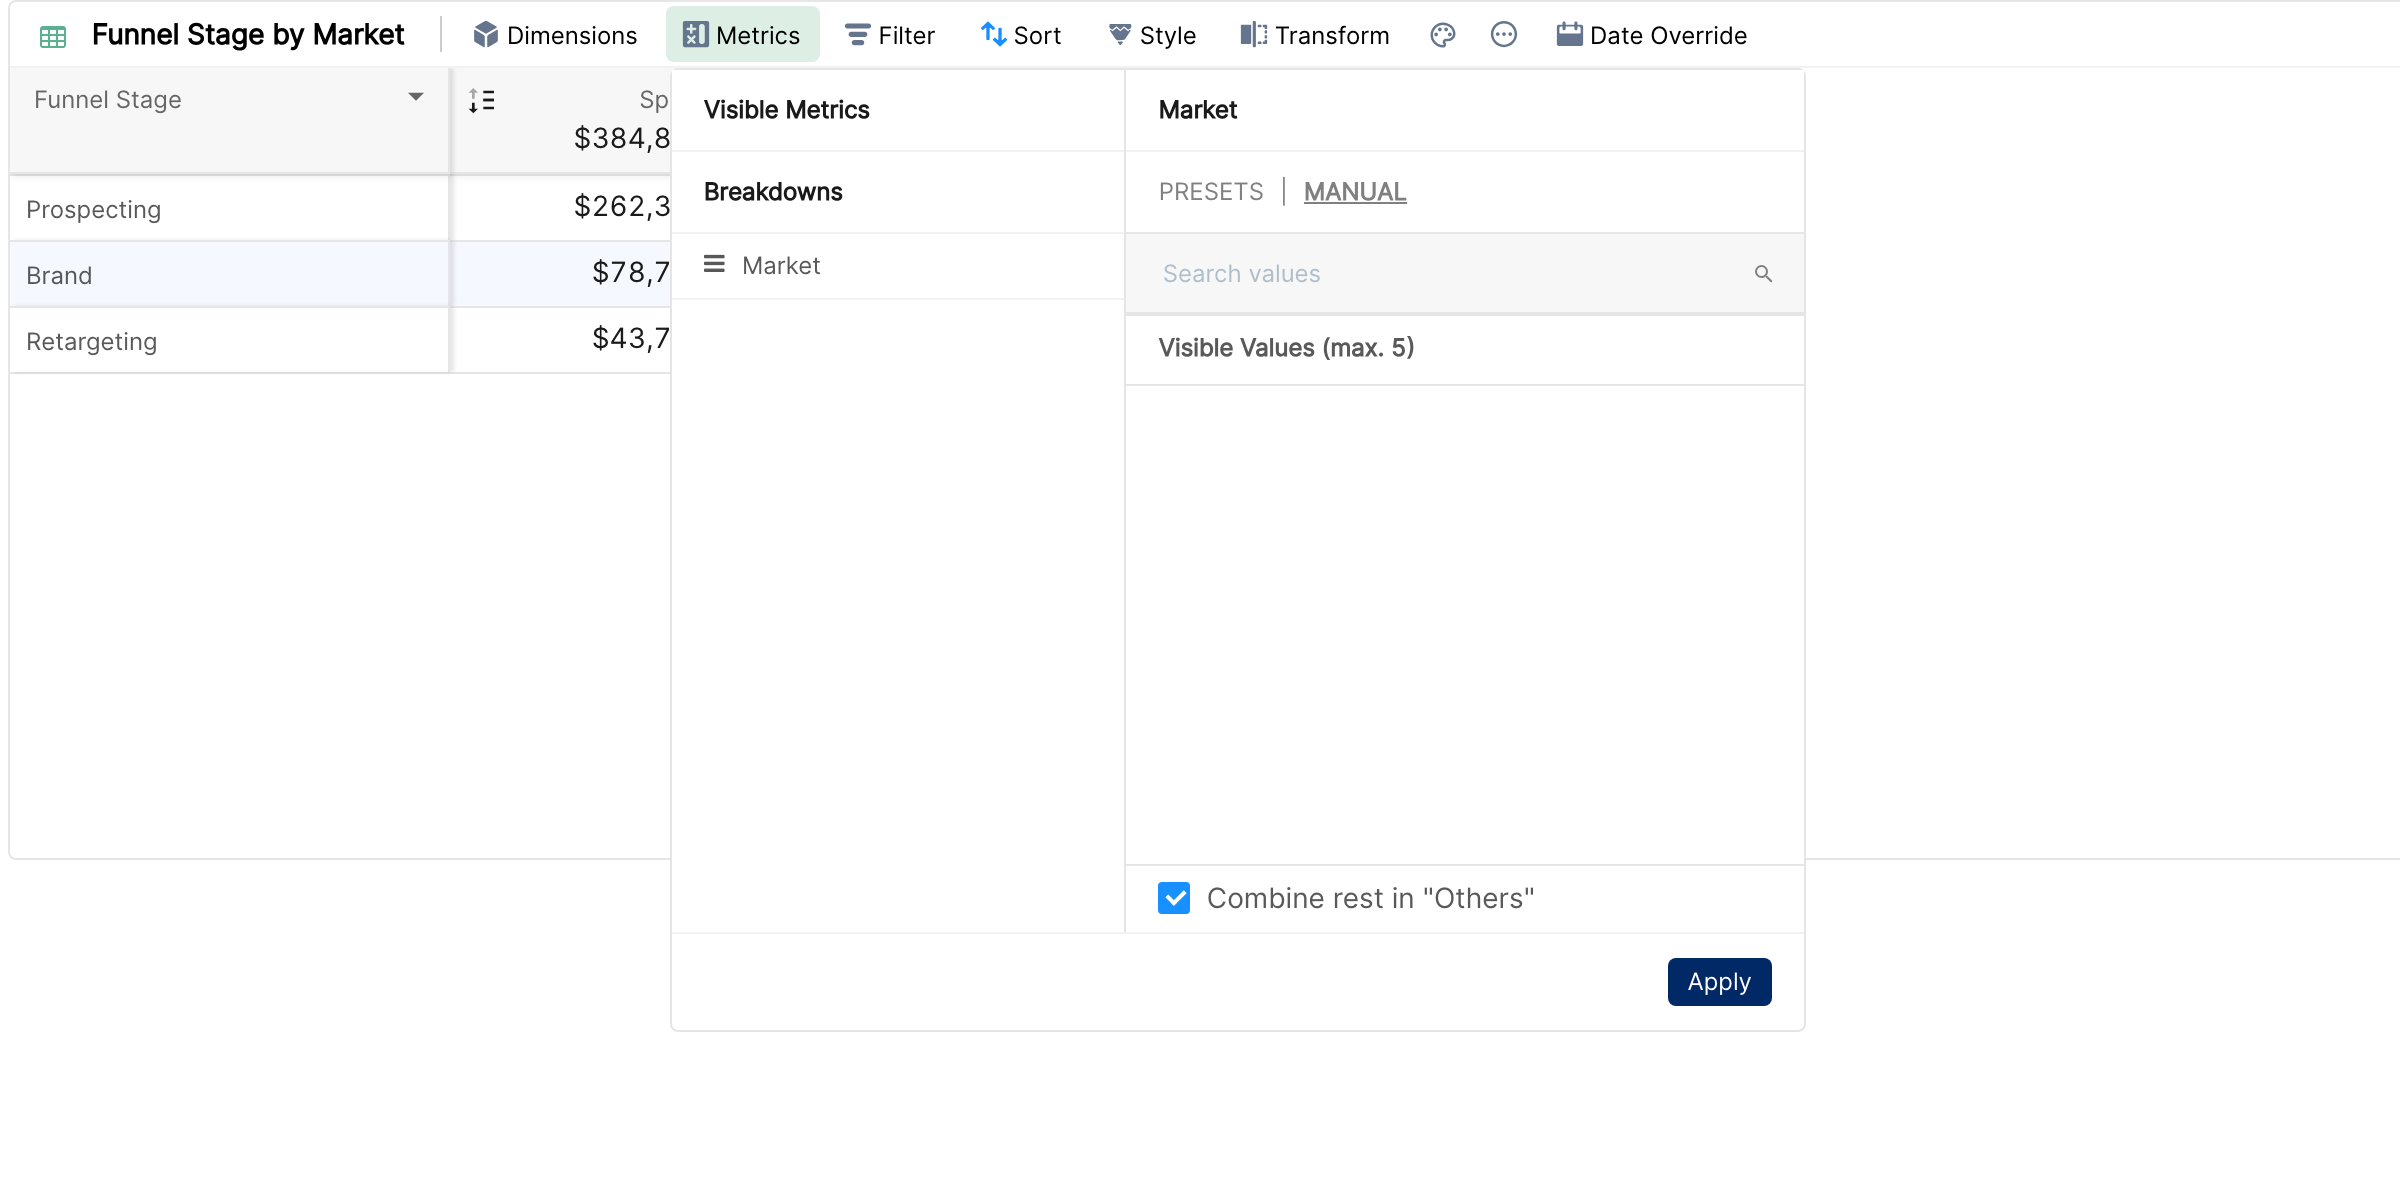
Combine rest in "Others" (on by default) adds an Others sub-column with all the values that don't have their own column. Turn it off to show only the chosen values.
Sorting the sub-columns
Open Sort. The Metric Breakdown Sort section (marked All Metrics) sets the order of the sub-columns, by a metric or by the dimension. With Presets, the sort also decides which values are the top ones.
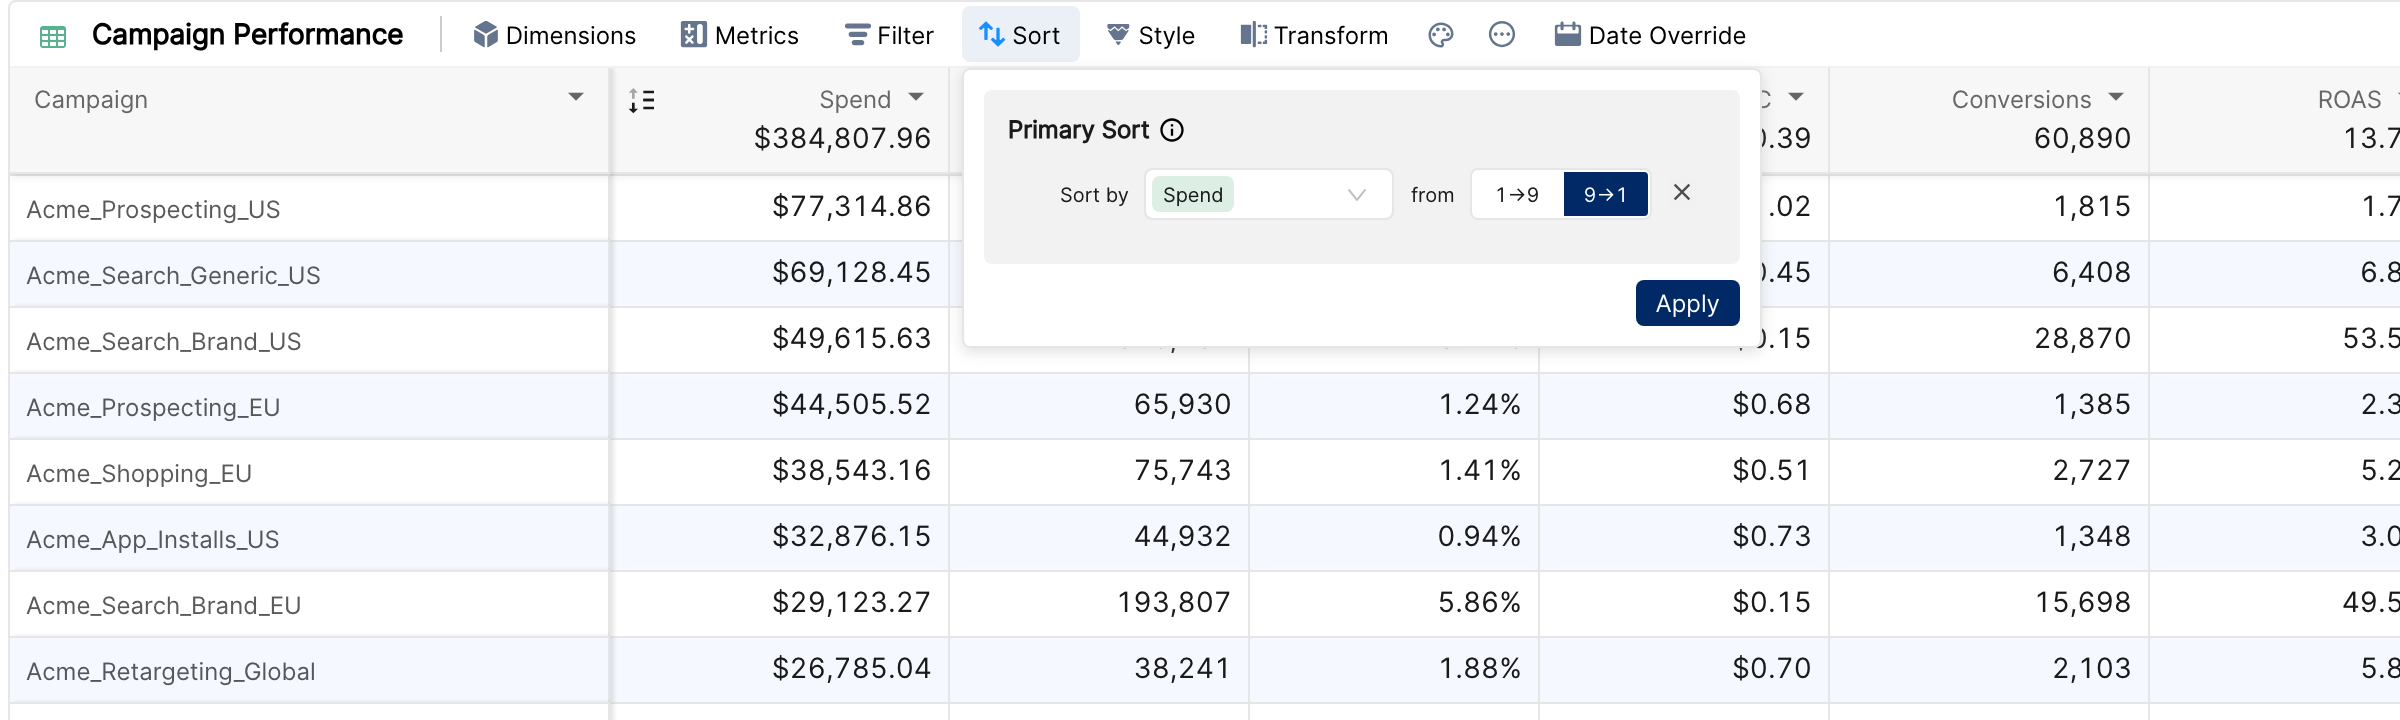
Tip: for a time breakdown such as Week, sort the breakdown by the time dimension so that the columns are in date order.
Examples
Markets side by side: rows by Campaign, metrics Spend and ROAS, breakdown by Market (Presets, 3 values, with Others).
Week over week: rows by Channel, metric Conversions, breakdown by Week (6 values), sorted by Week.
One value vs the rest: metric CPA, breakdown by Promotion with Manual set to "Summer Sale" and Others on. You get CPA (Summer Sale) next to CPA (Others).
Things to know
Metric breakdowns are available in the table widget only.
A table can have metric breakdowns or metric slices, not both. If the table has slices, the Breakdowns section shows "Breakdowns are disabled. Remove metric slices to enable breakdowns."
A column with sub-columns can't be frozen.
Transforming the widget into another type removes the metric breakdown.
To split rows instead of columns, use dimension breakdowns: see Displaying additional data: breakdowns.