
Breakdown chart widget
Breakdown charts break down a metric by the values of a breakdown dimension and show these values over another dimension. This visualization needs exactly one dimension, one metric and one breakdown.
The breakdown chart below breaks down Spend by Market over days, so you can see how much was spent in each market on each day of the selected time range.
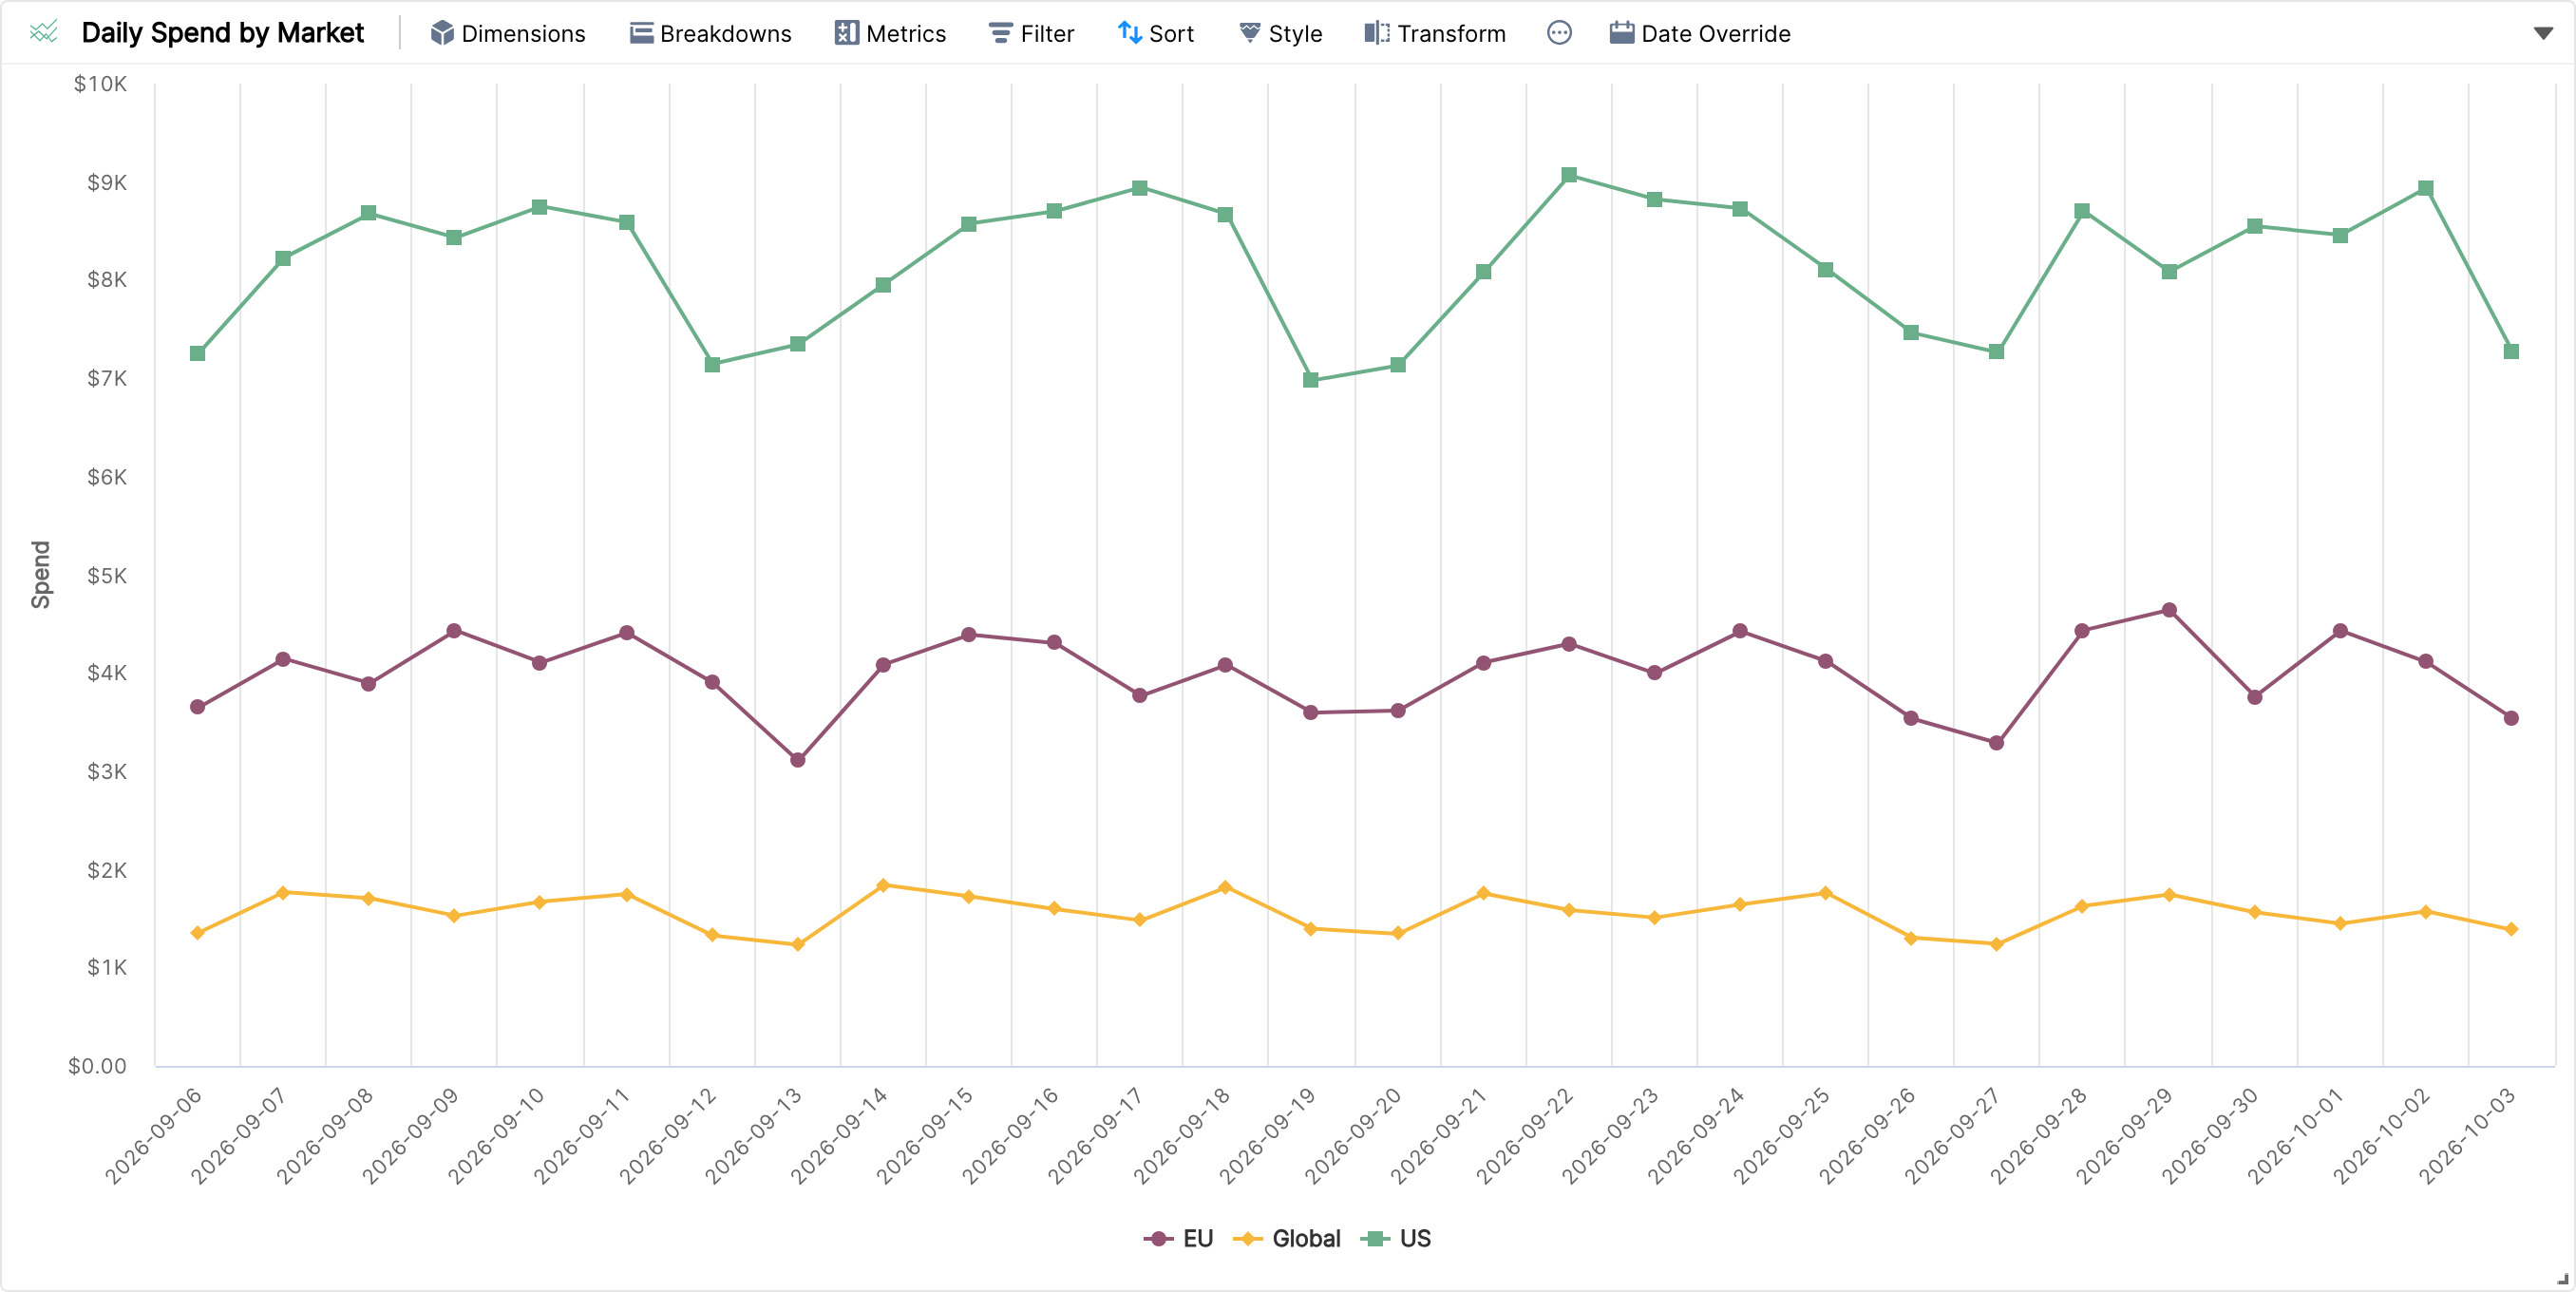
Zoom in by clicking and dragging over a range in the chart.
Use the drop-down at the top right of the widget to choose how many breakdown values to show (5, 10, 20 or 50).
Filters and sorting are supported.
Under Style you can customise the axes and show labels. Colours are set per breakdown value.
Other examples of breakdown charts: CTR broken down by Channel over Weeks, Countries or Product Categories.