
Stacked chart widget
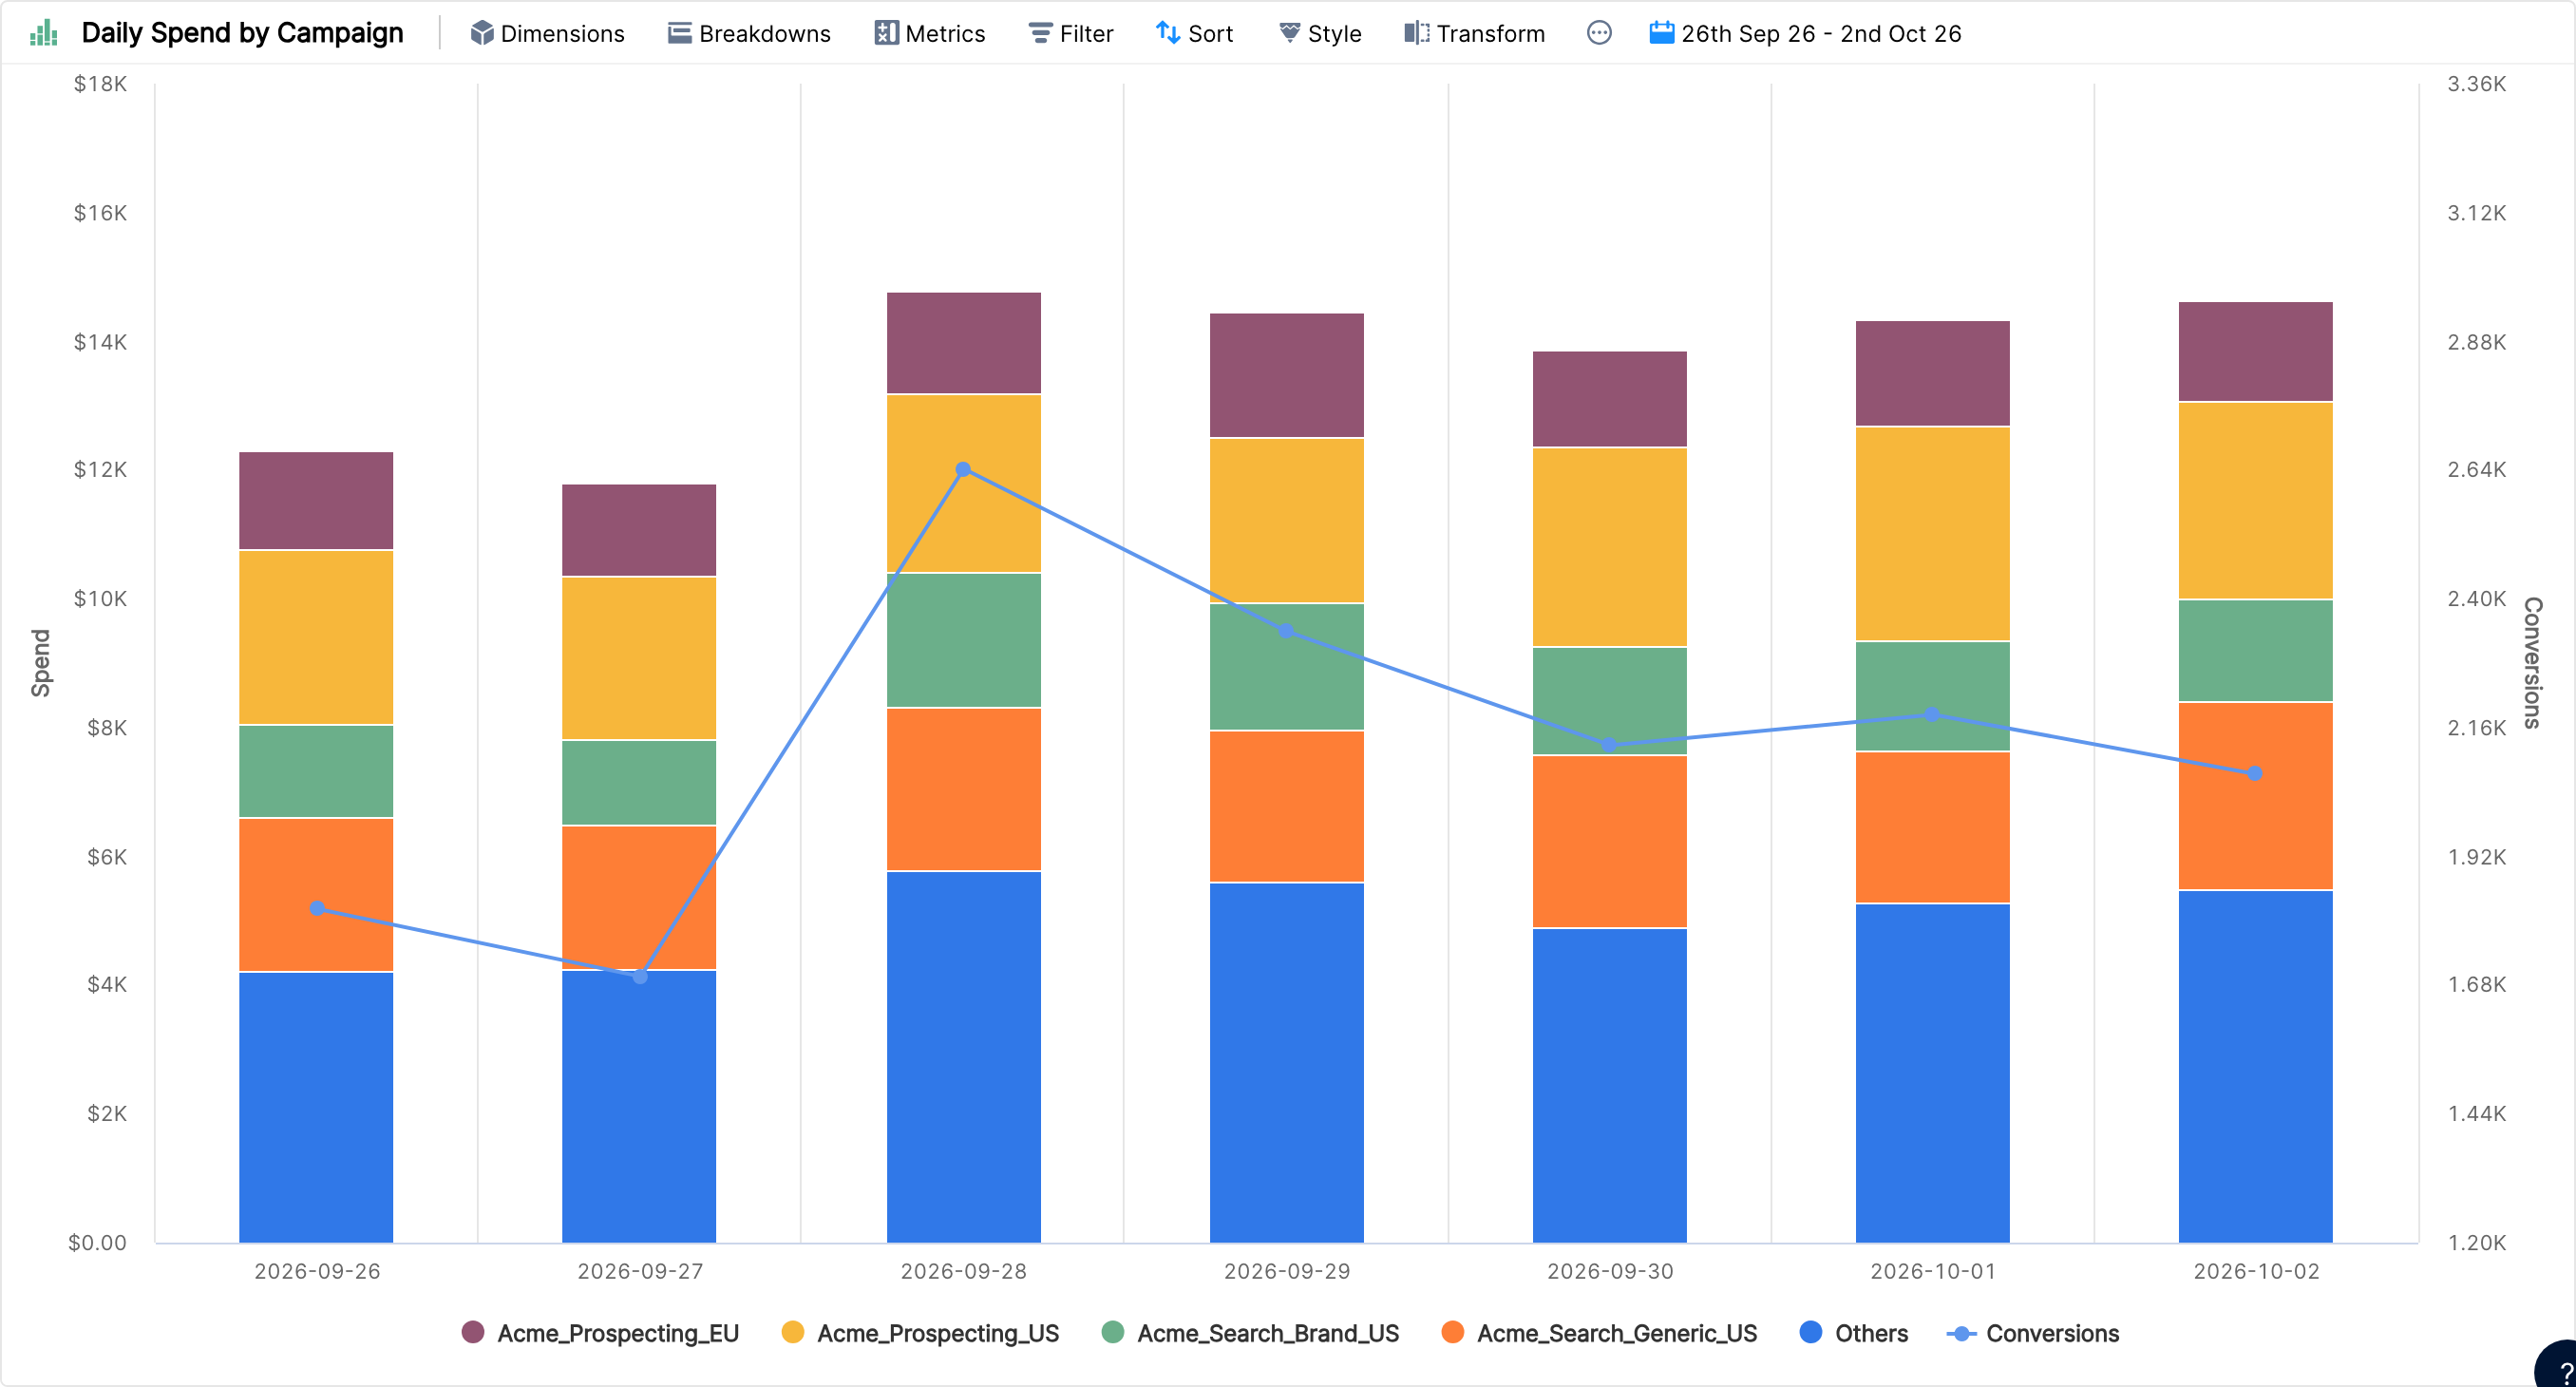
A stacked chart, also known as a stacked bar graph, breaks down and compares parts of a whole. Each bar represents a whole, and the segments in the bar (the stacks) represent different parts or categories of that whole. Each category has its own colour. Here is a sample stacked chart:
How to create a stacked chart
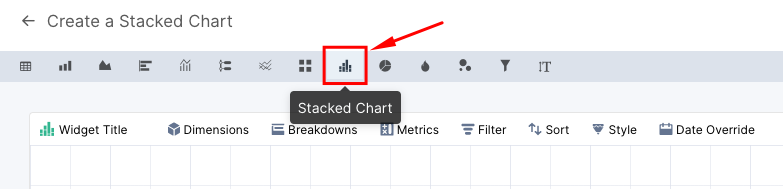
Click Create Widget and choose Stacked Chart in the widget type bar.
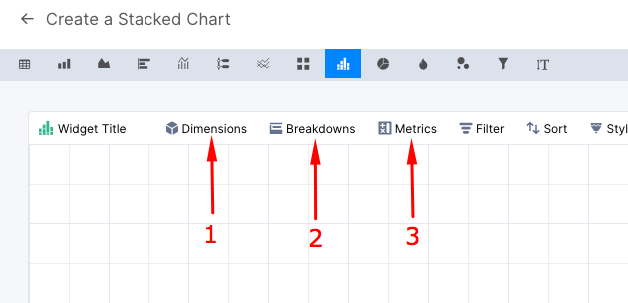
The stacked chart has three elements:
The dimension corresponding to each bar of the chart
The breakdown dimension corresponding to the stacks in each bar
The metric that is plotted on the y-axis
Choose these elements in the widget properties, as shown below.
You can also add a second metric, which is plotted as a line. The first metric cannot be a ratio metric (such as CTR or CPC).
See the stacks that matter most
Stacked charts get harder to read the more segments each bar has.
So in Clarisights stacked charts, the stacks with less data are grouped into Others, as in the chart at the top of this article. Only the top stacks across all bars for the chosen metric are displayed, and the rest are grouped.
Choose the total number of stacks under Style, in No. of Stacks. The options are 5, 10 and 15: 10 is the default and 15 is the maximum. For example, if you choose 10 stacks, you see the top 9 stacks and everything else is grouped into Others.

Turn on 100% Column View in the same panel to compare the percentage share of each stack across the bars.
Learn about other widgets in Types of Widgets in Clarisights.