
Horizontal chart widget
A horizontal chart is like a column chart with the axes swapped: dimensions are on the vertical axis and metrics on the horizontal axis.
Multiple dimensions and metrics are supported, and you can show them with different colors and move them into separate axes.
Horizontal charts don't have breakdowns, but you can get a similar result: when you choose multiple dimensions, each combination of the dimensions becomes a separate value, which works as a breakdown of the dimensions together.
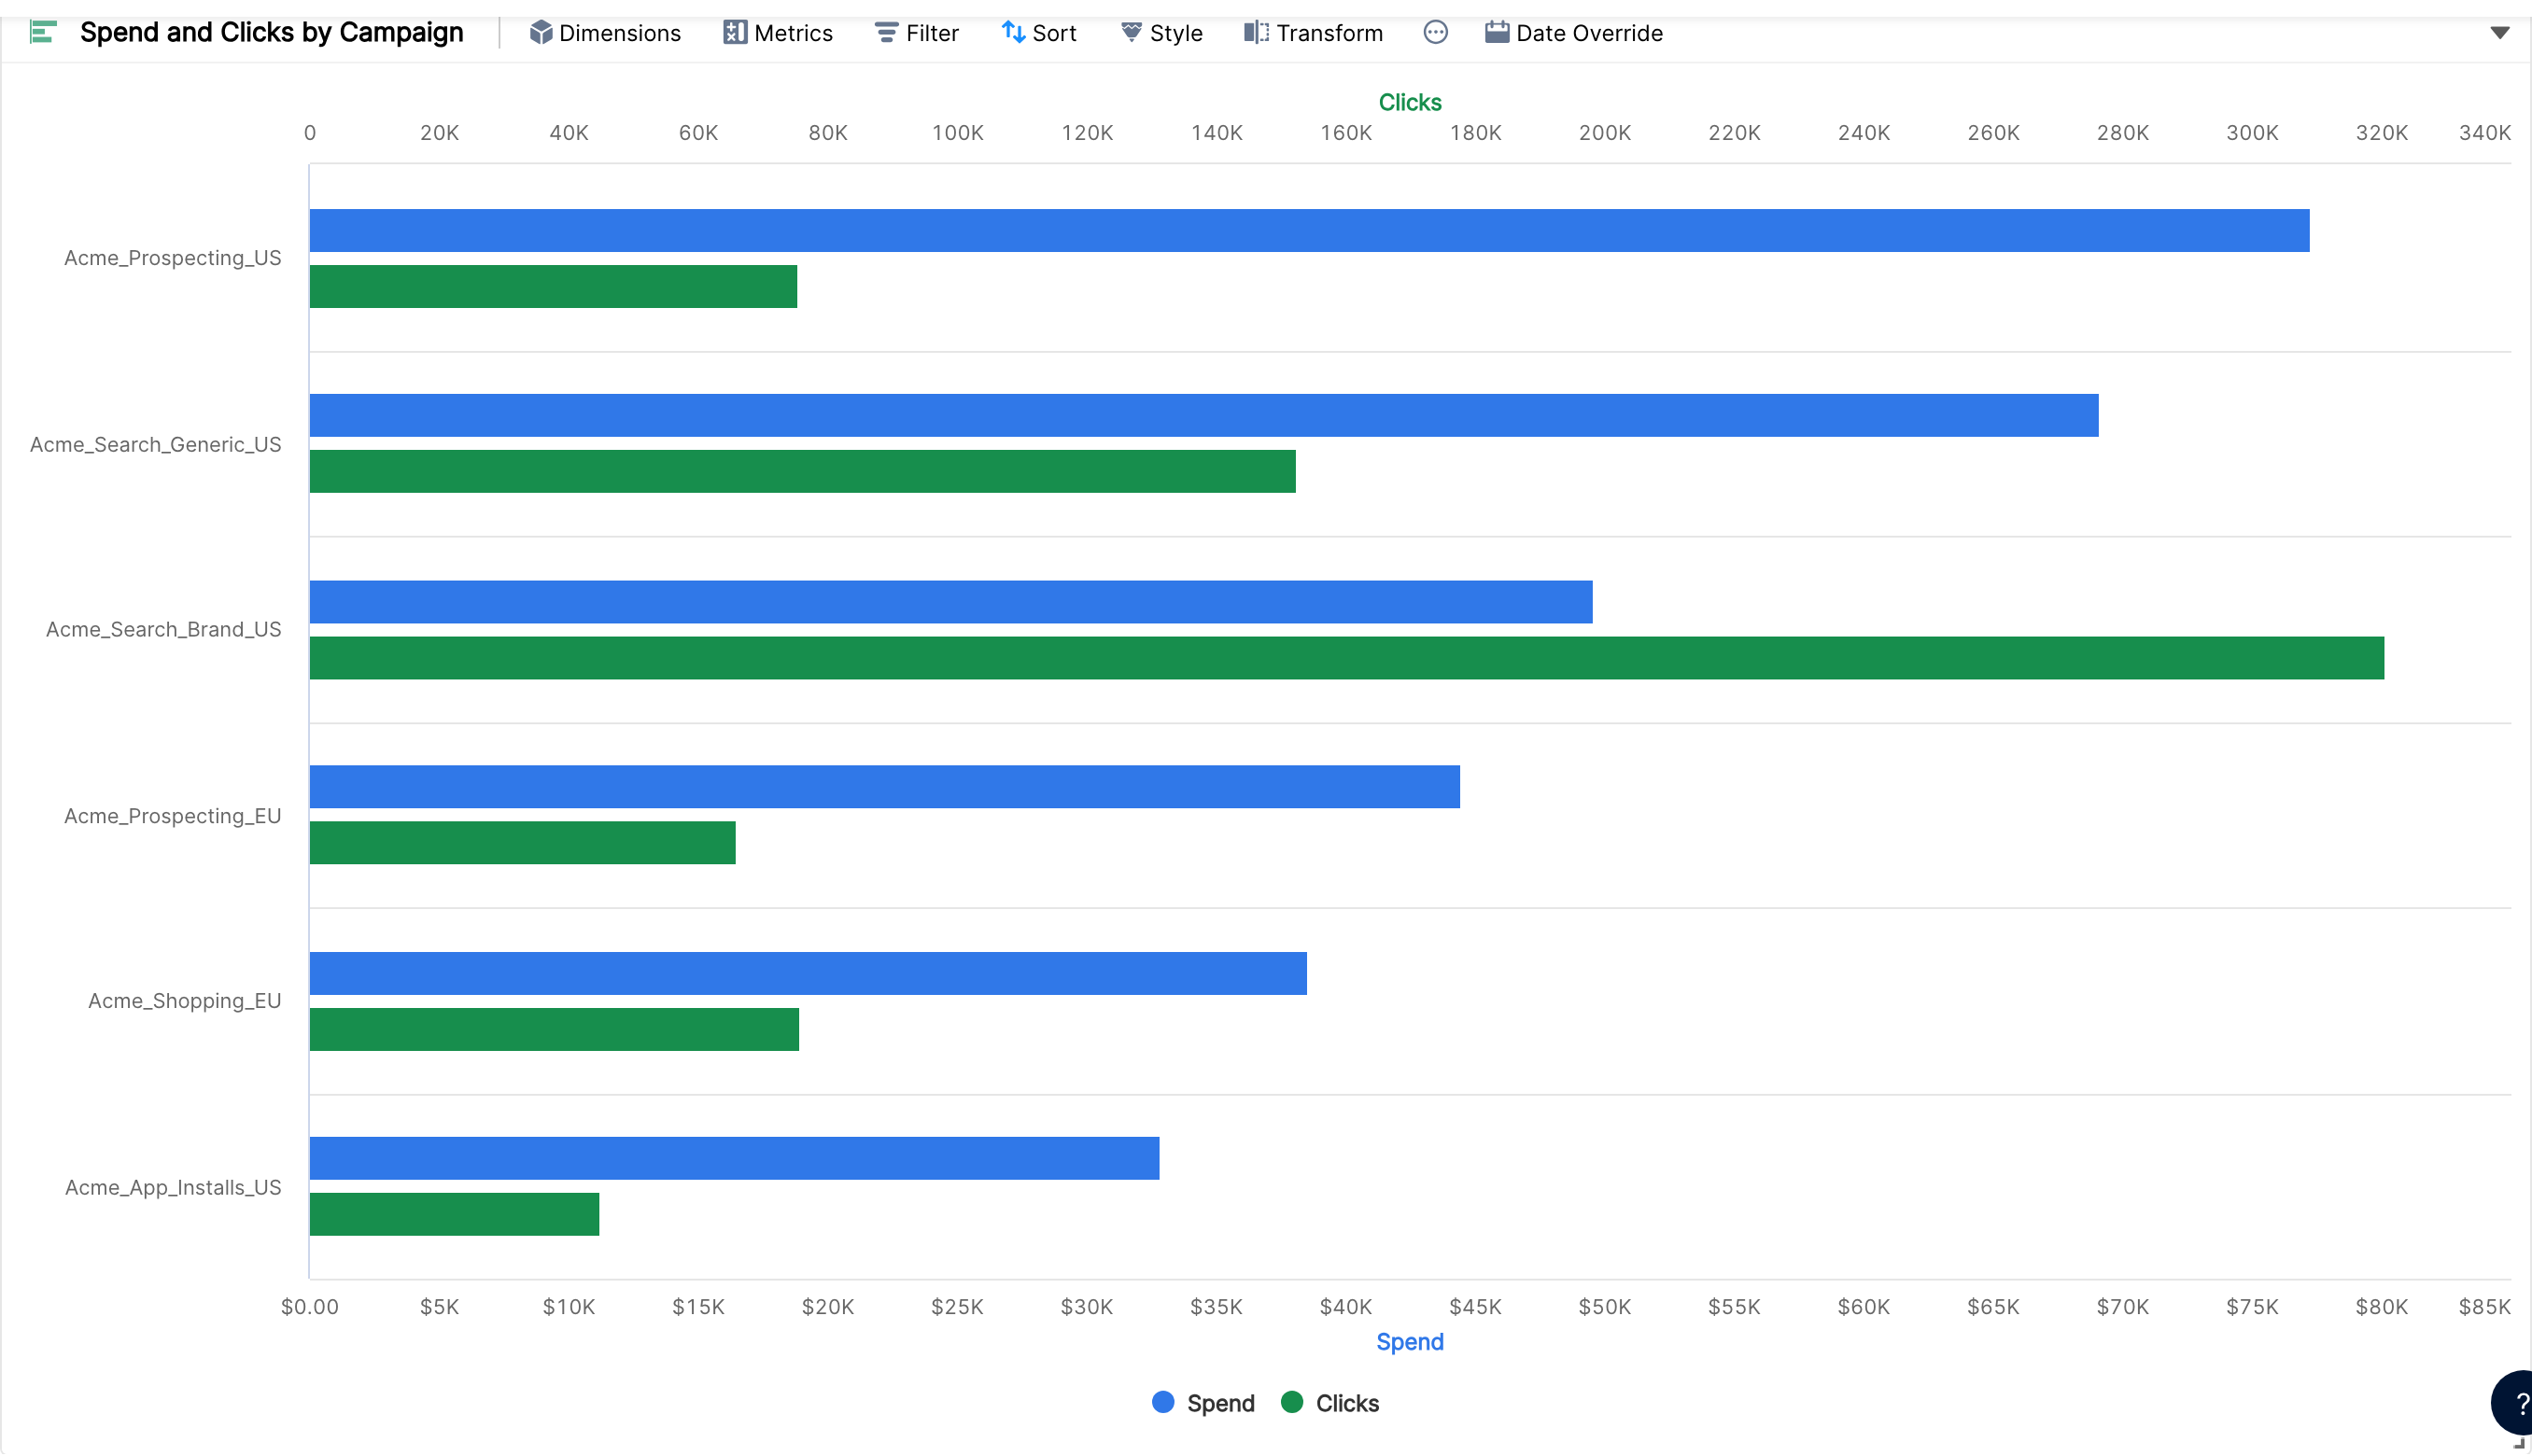
You can go deeper by adding more dimensions one by one.