
Pivot table widget (deprecated)
Pivot tables are deprecated. Existing pivot tables keep working, but don't create new ones. To spread a metric across the values of a dimension (for example Spend by market), use metric breakdowns in the table widget instead.
What is a pivot table?
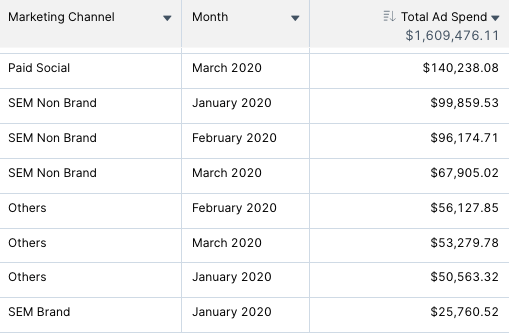
A regular table lists data in a flat format: one row per combination of dimension values, as below.
A pivot table summarizes the same data in a grid: one dimension down the rows, another across the columns, and one metric in the cells. Totals for each row and column are easy to read.
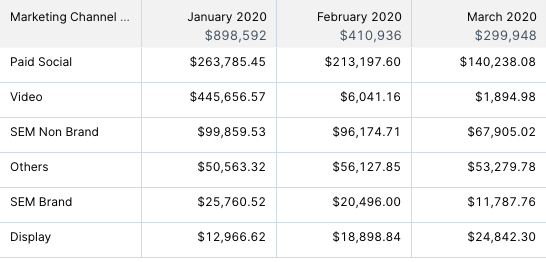
In this example the row dimension is Marketing Channel, the column dimension is Month and the metric is Total Ad Spend.
Creating a pivot table
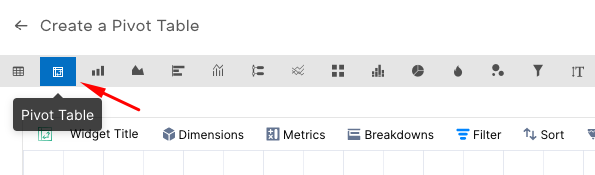
Click Create Widget and choose Pivot Table in the widget type bar. You can also turn an existing widget into a pivot table with Transform.
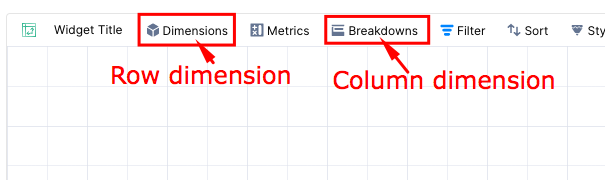
Add the row dimension in Dimensions, the column dimension in Breakdowns and the metric in Metrics.
Click Done.
Note: a pivot table shows one metric. If you add more than one metric, only the first one in the list is used. To see several metrics split by a dimension, use a table with metric breakdowns instead.
You can add filters and change the sorting. By default, rows and columns are both sorted by the metric, highest first.
Sorting by time
When the column dimension is a time dimension such as Week or Month, the columns are still sorted by the metric by default, not by date. To show them in date order:
Click Sort and then +Breakdown Sort.
Sort the breakdown by the time dimension, oldest first, and click Apply.

Style options
Click Style in the widget toolbar:
Alternate row color shades every other row.
Row Sizing sets the row height (three sizes).
No. of Columns sets how many column values are shown: 30 (default), 60 or 100. The remaining values are grouped in an Others column, which keeps large pivot tables fast.

More options
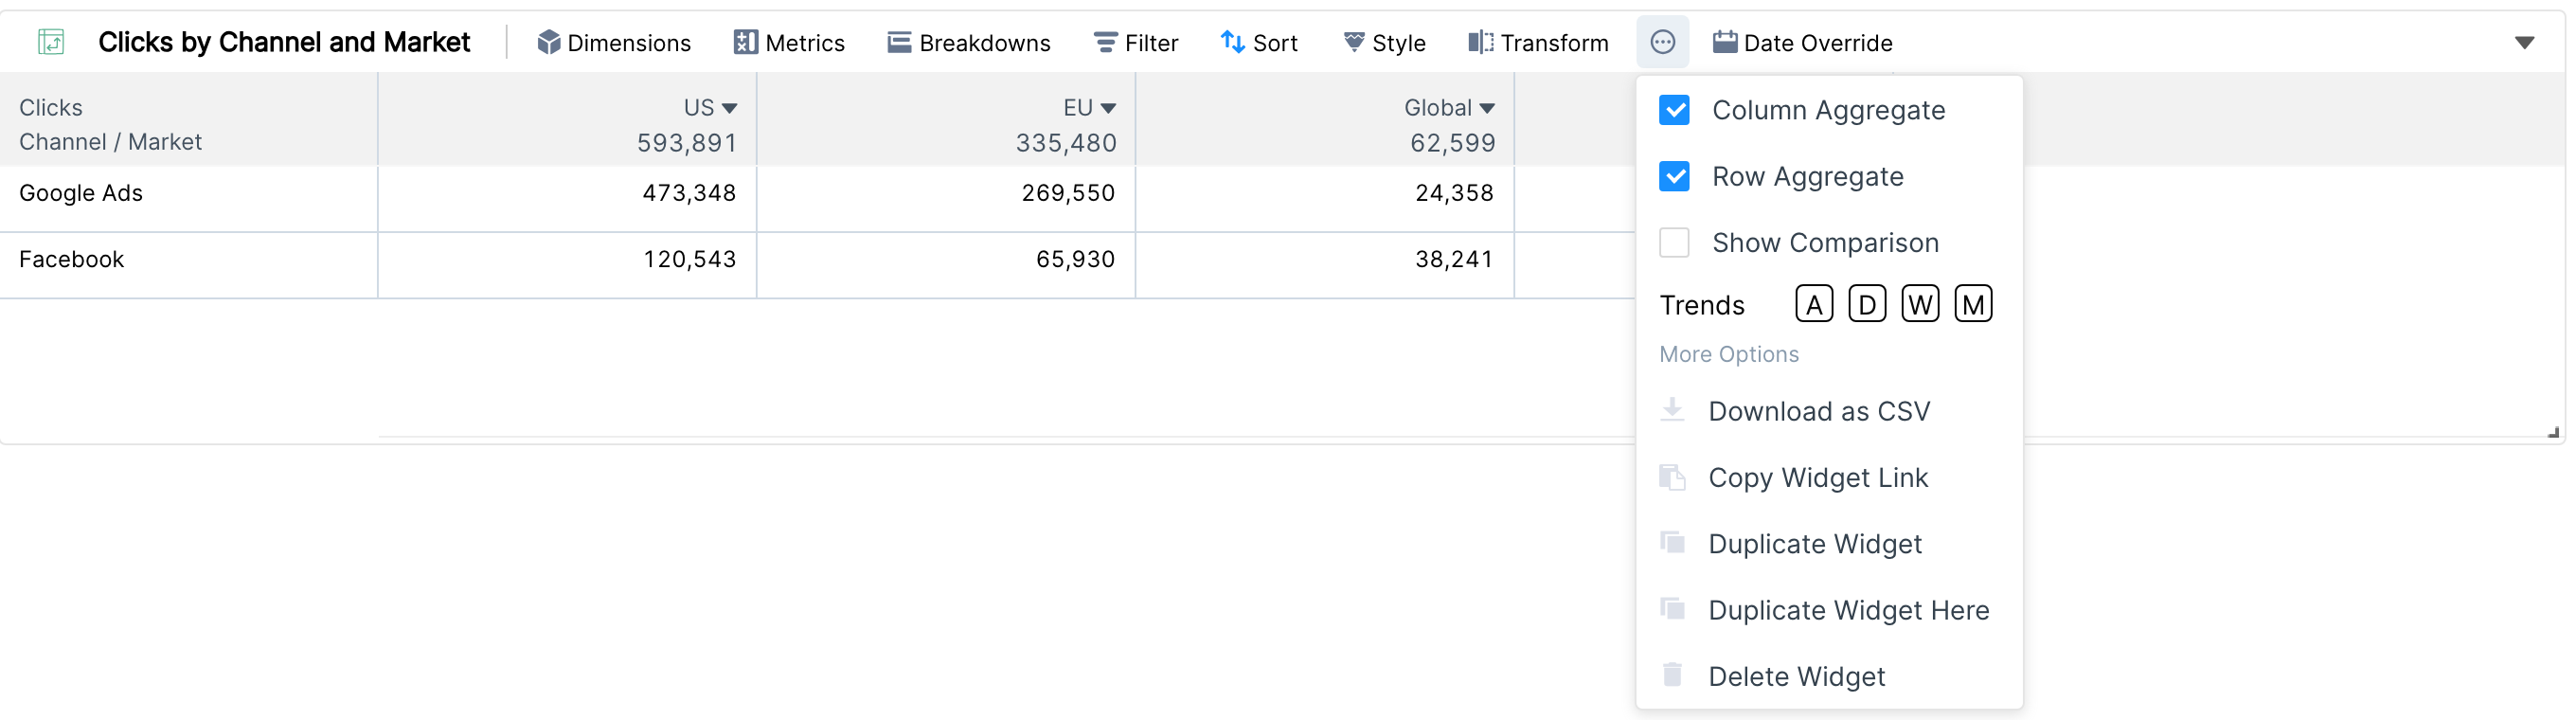
The more options menu (the "..." icon) has these settings for pivot tables:
Column Aggregate: the total of each column, shown in the column header.
Row Aggregate: a Total column with the total of each row. It is available for summable metrics.
Show Comparison: values and % change for the comparison date range.
Trends (A, D, W or M): a sparkline in each cell. You can hide the trend of a single column from its column menu with Hide Trends.
Download as CSV, Copy Widget Link, Duplicate Widget, Duplicate Widget Here and Delete Widget.
Pivot tables don't have Show Share%, conditional formatting or Auto Resize. Those are table features.
FAQ
Some rows seem to be missing after I transformed a chart into a pivot table. The number of rows is limited by the item count. Choose a higher number in the drop-down at the top right of the widget.
Why do I see an Others column? The pivot table shows at most the number of columns set in No. of Columns. Everything else is added up in Others.
Learn about the other widgets in Types of widgets in Clarisights.