
Overview of report structure
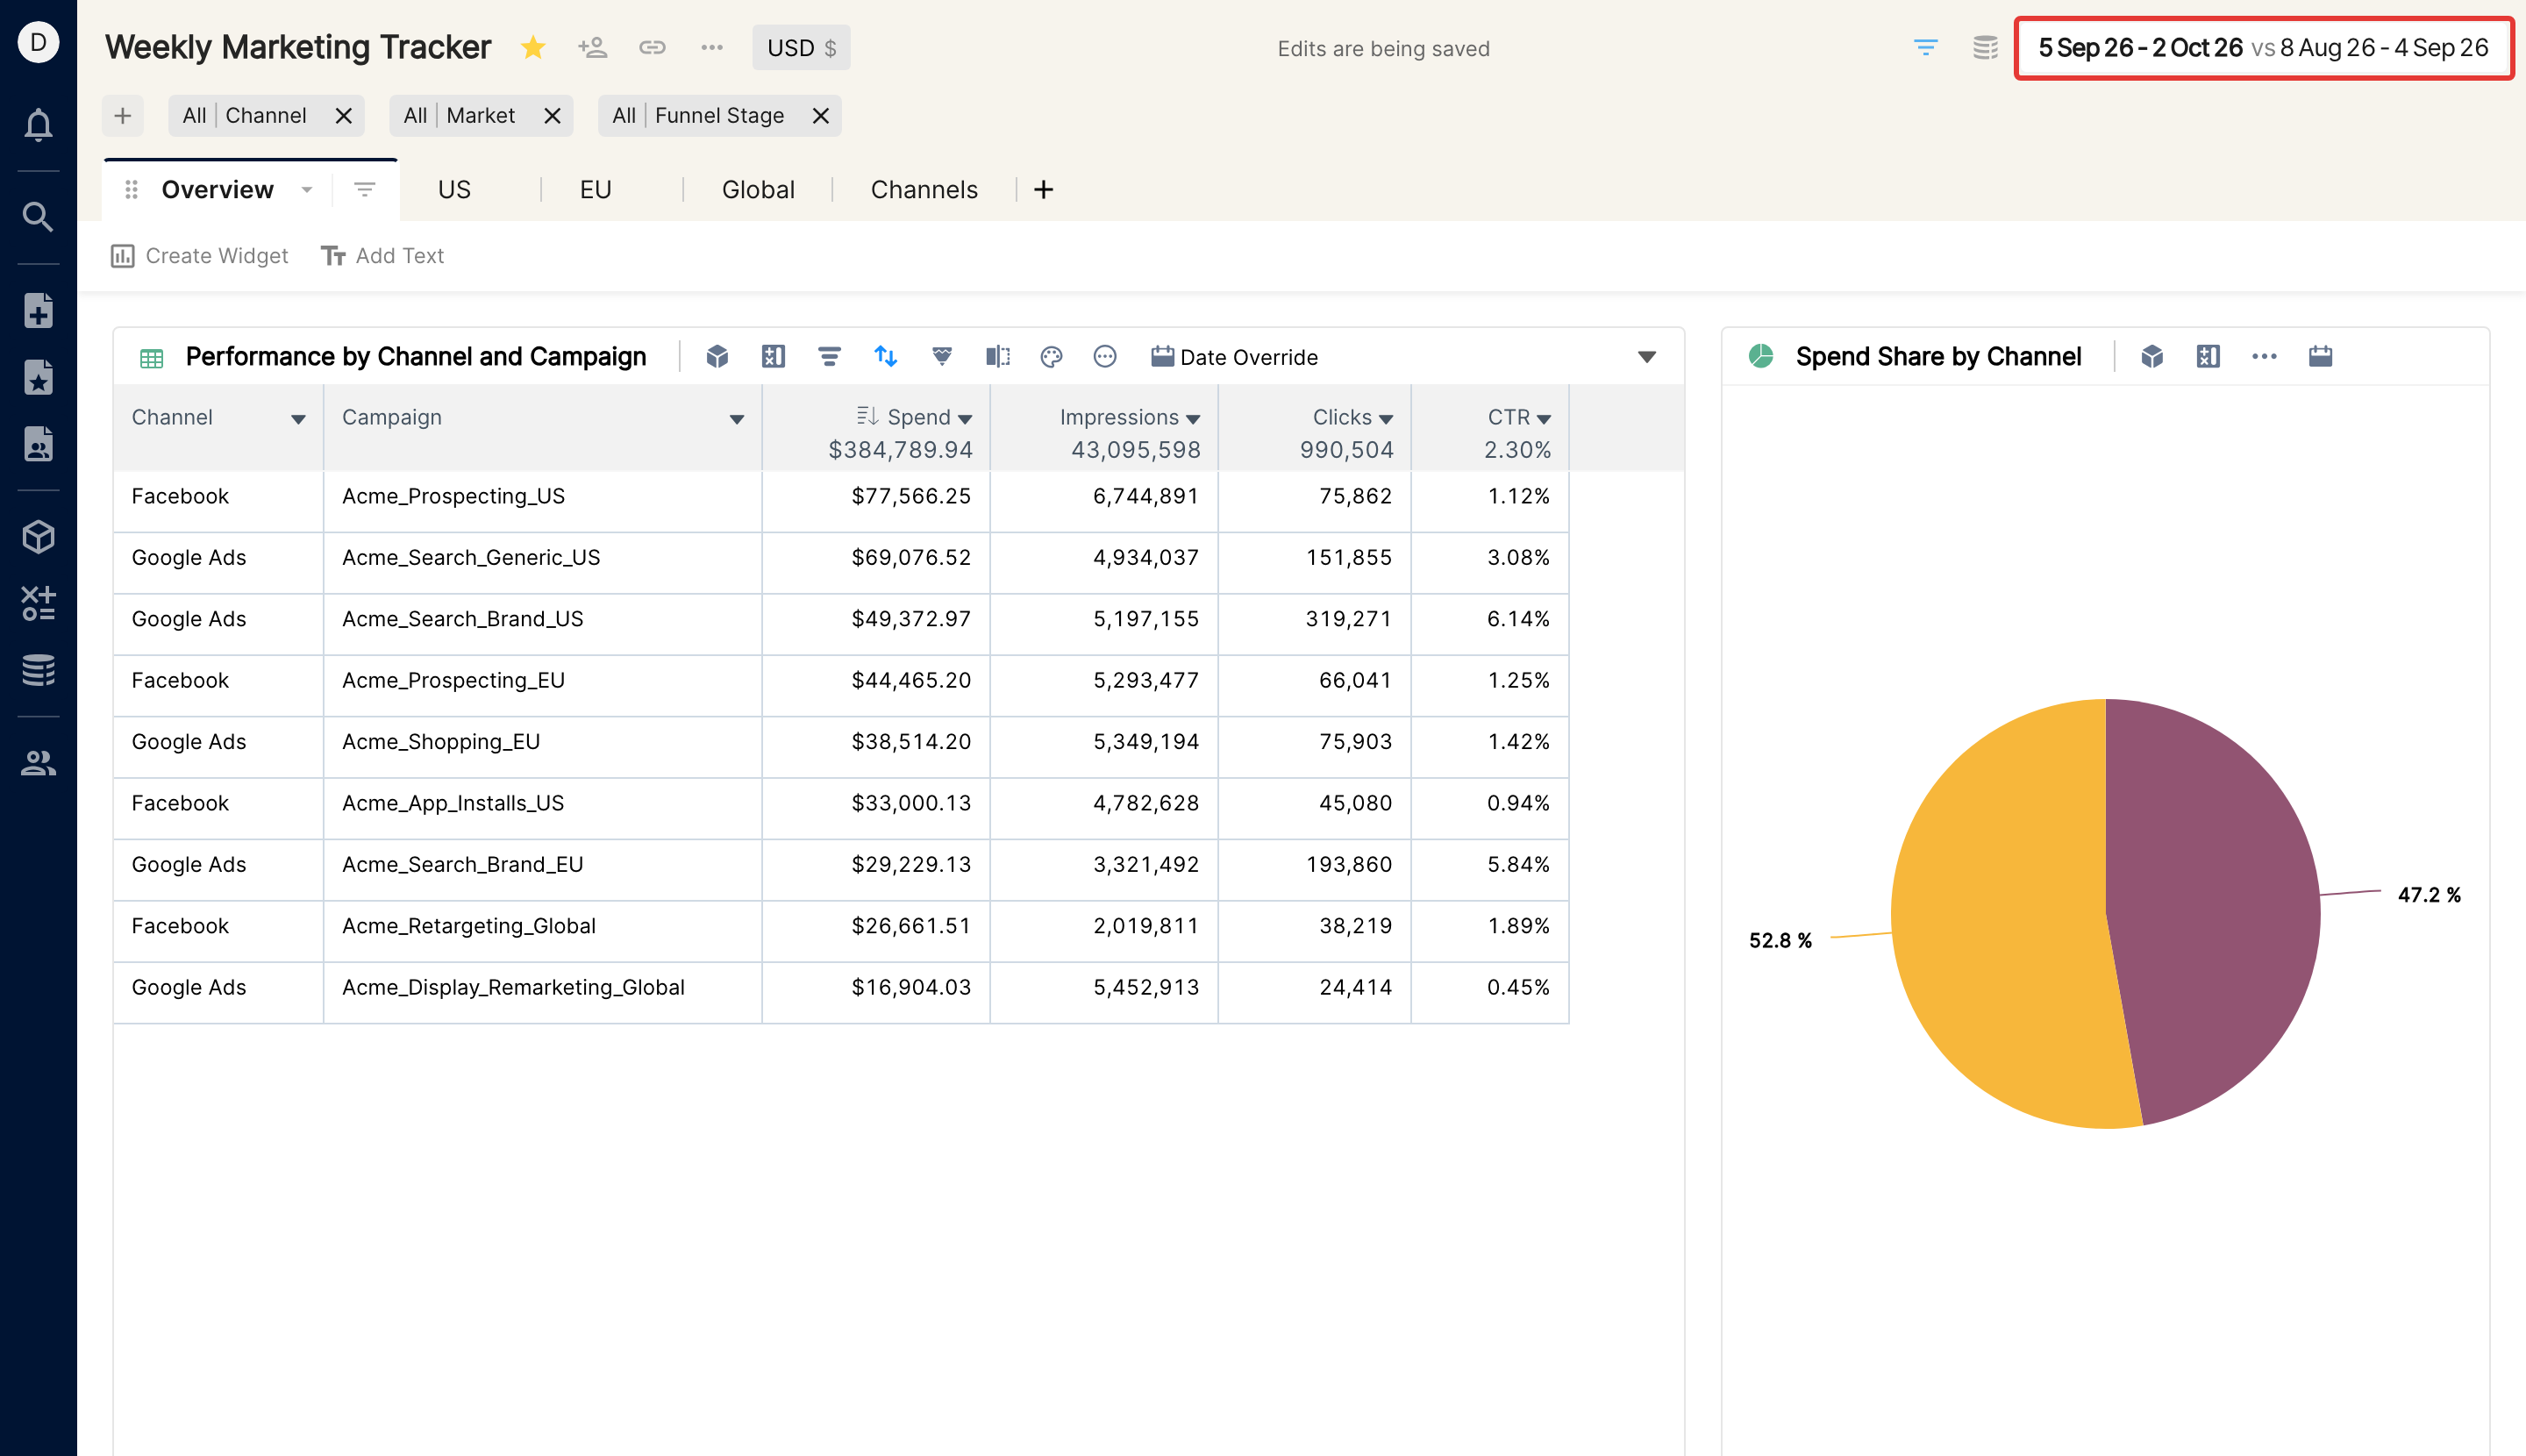
The first time you log in, you're taken to the first report you have access to, in alphabetical order. All reports in Clarisights have a similar structure: the report name at the top left, and the date range selector at the top right.
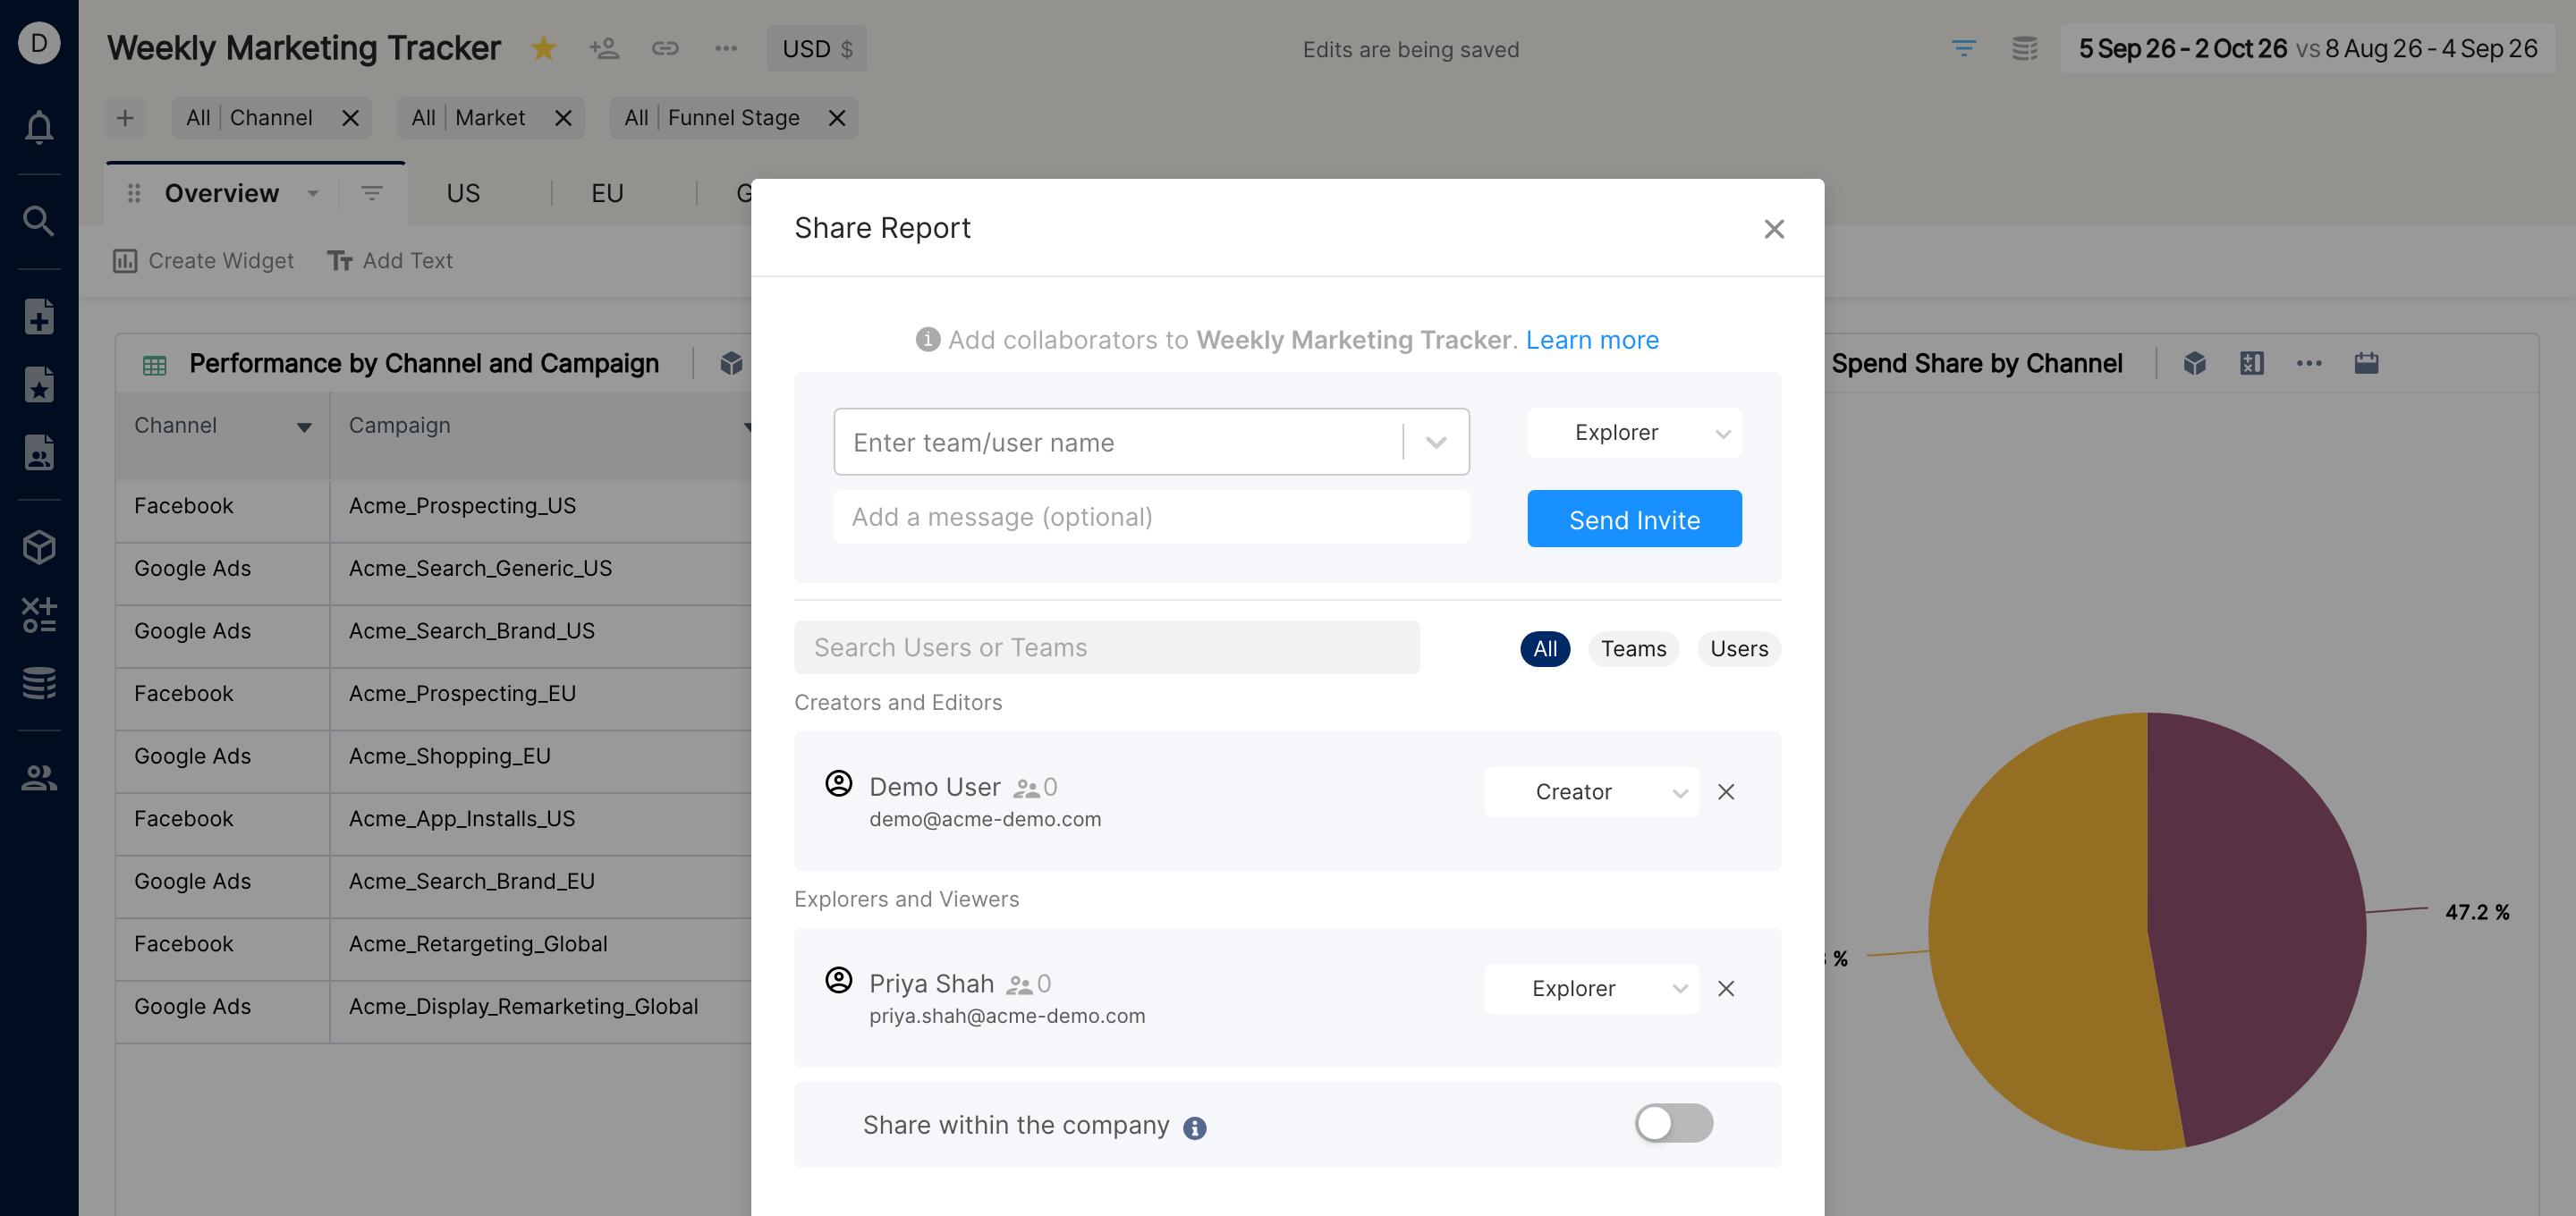
Sharing & access levels
The message at the top center of the window shows whether your changes to the report are being saved. To see the report's detailed sharing settings, use the share option next to the report name.
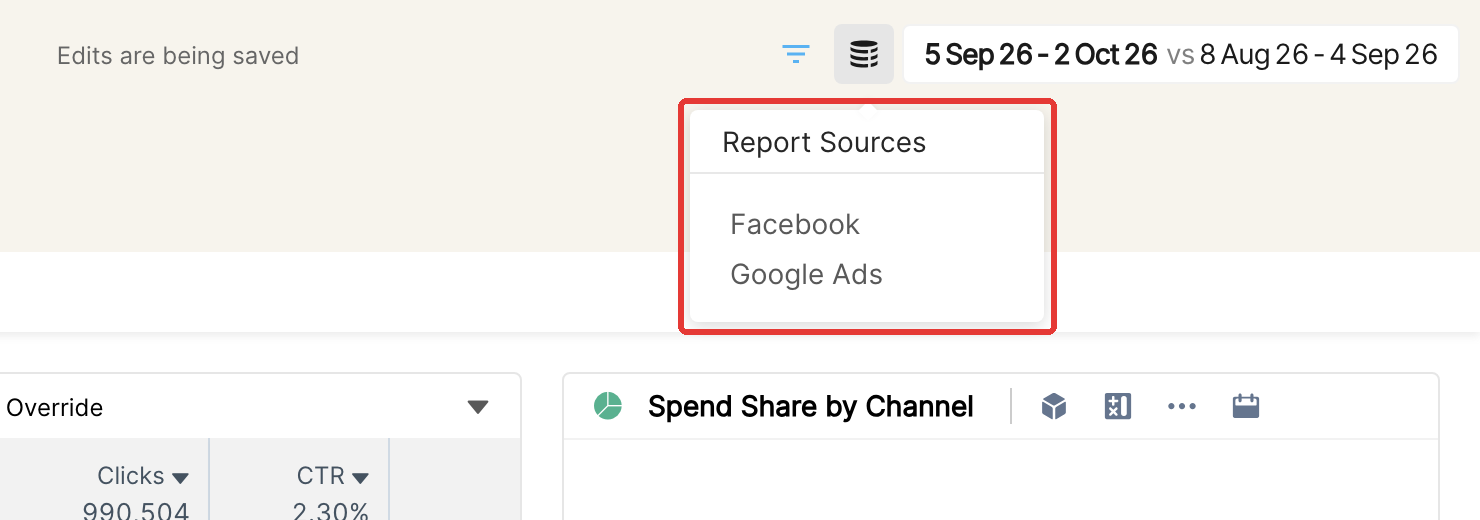
Hover over the database icon at the top right to see the data sources in the report. If you're the creator, click it to open Report Settings and change the data sources. Changing the data sources only affects this report.
Tabs
Every report in Clarisights is a container for multiple tabs, each holding its own widgets. Each tab can be filtered to a subset of the data, and each widget in that tab can be filtered further for the specific insight you want to show.

Finding reports
To search the reports you have access to, use the search icon in the left panel or press Ctrl/Cmd + K.
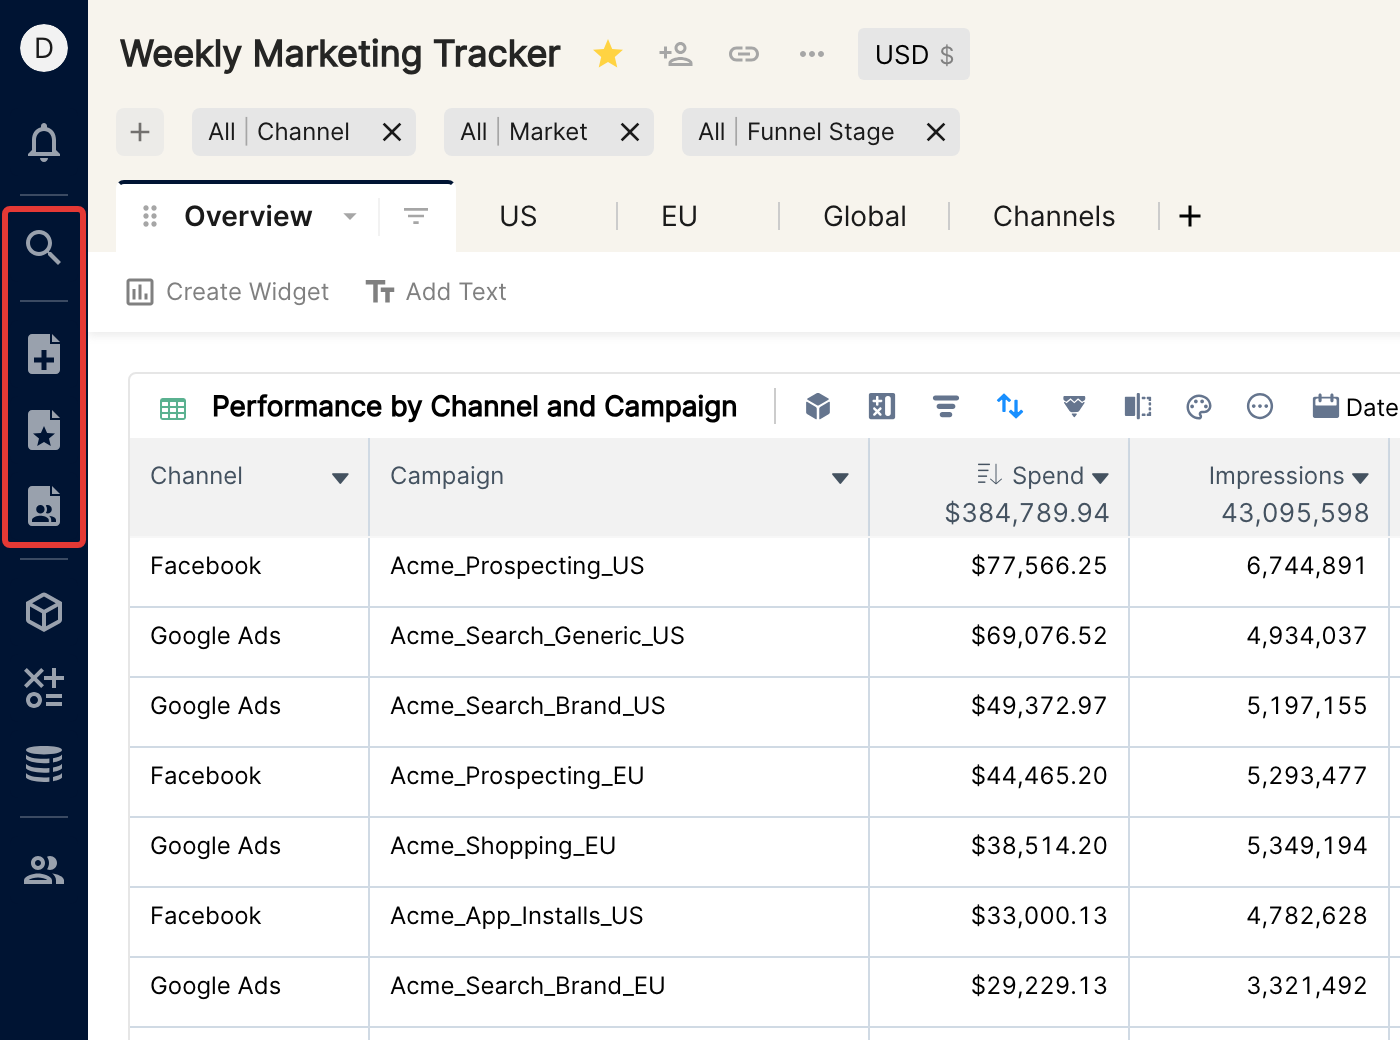
Reports lists all reports you have access to, including the ones you created.
Starred Reports lists the reports you have starred.
This was an introduction to the reporting interface on Clarisights. The next articles in this self-starter guide cover dimensions and metrics, and how to use them in widgets to explore insights.
Go to next article