
Dimensions, Metrics and Data Sources
In the previous article in this series, you got an overview of the report structure in Clarisights. This article covers the building blocks of reporting in Clarisights: dimensions, metrics and data sources.
In Clarisights, all the data you use to create reports and analyse information comes in the form of dimensions and metrics.
Dimensions
Dimensions and dimension values are qualitative. For a Facebook Ad Campaign, the Campaign name, ID, Campaign Type, Start Date and so on are dimensions that describe that campaign. You can use dimensions to categorize, group and break down your data into granular detail.
On Clarisights, dimensions are timeless attributes. For example, if the name of a Facebook Ad Campaign changes, it changes on Clarisights too, for the entire period the campaign has data for.
There are two kinds of dimensions in Clarisights:
System dimensions come into Clarisights as part of the original imported dataset. For example, Campaign Type is a system dimension from Google Ads that represents the type of campaign (Search, Display, UAC and so on). Clarisights has many system dimensions from the integrated ad channels, and you can use them in places like reports and custom dimensions.
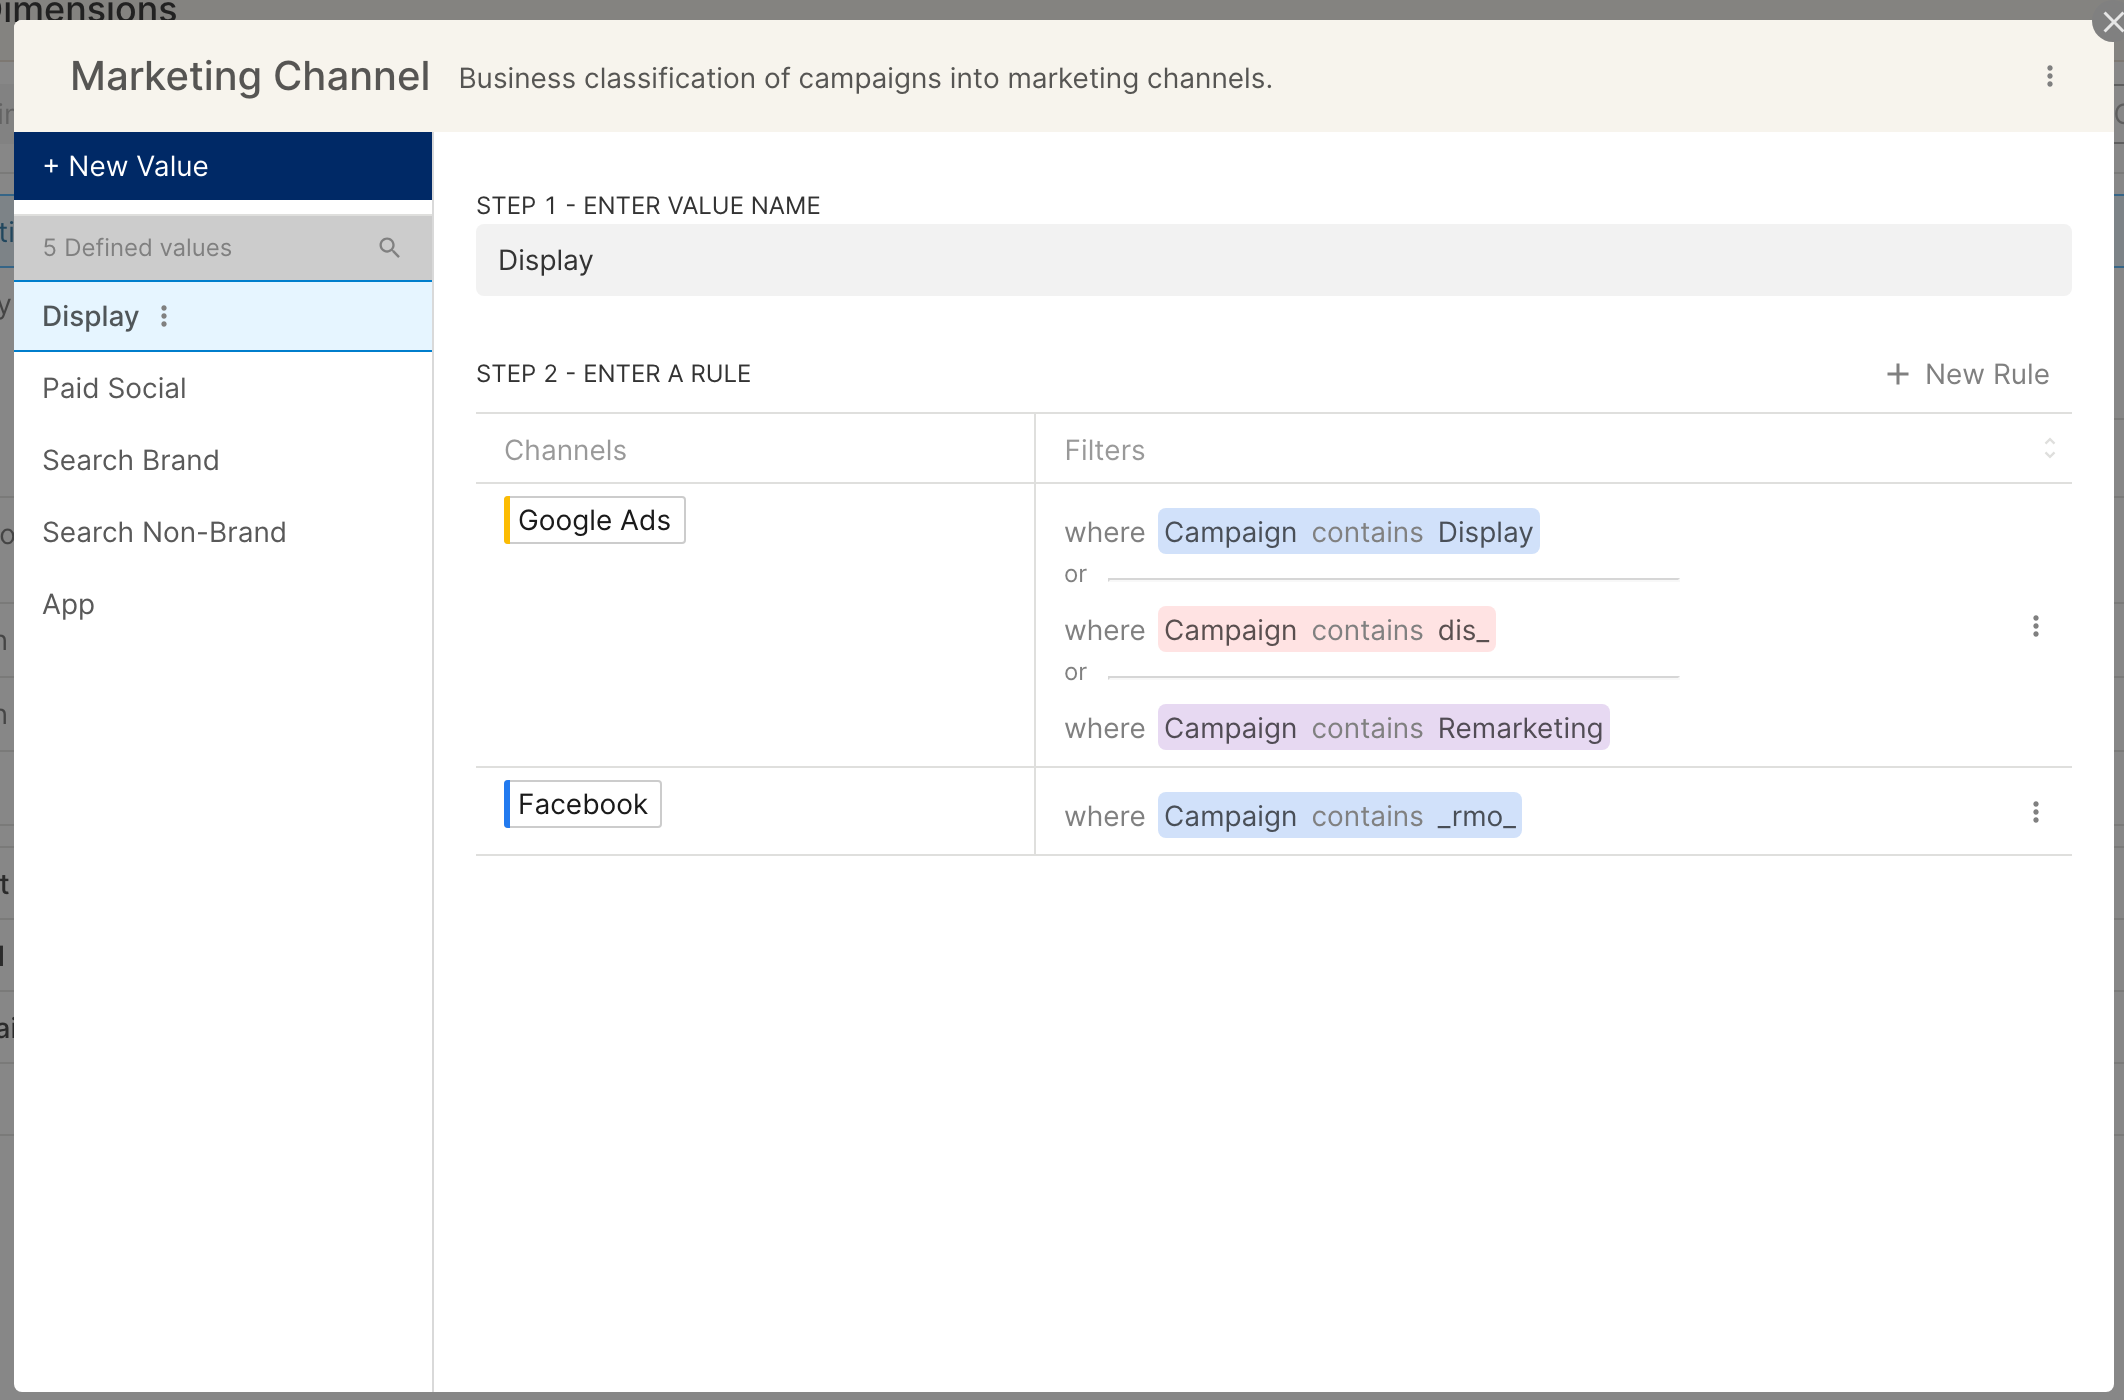
Custom dimensions are created by users on top of the data that comes in from an external source. Editors or Admins can create custom dimensions to group data in their own ways, and all other users can include them in their reports.
For example, Marketing Channel is a business classification that may not exist in the datasets from ad channels like Facebook or Google Ads. On Clarisights, you can create a custom dimension called Marketing Channel to group data from various sources in a way that is specific to your organization.
Metrics
Metrics and metric values are quantitative: you can measure them. Spend, Clicks and CTR are examples. Metrics in Clarisights are always attributed to dates. They change over time and you can track these changes in Clarisights, so all metric data in Clarisights is time series.
There are two kinds of metrics in Clarisights:
System metrics come into Clarisights as part of the imported dataset, and always start with an abbreviation of their data source. For example,
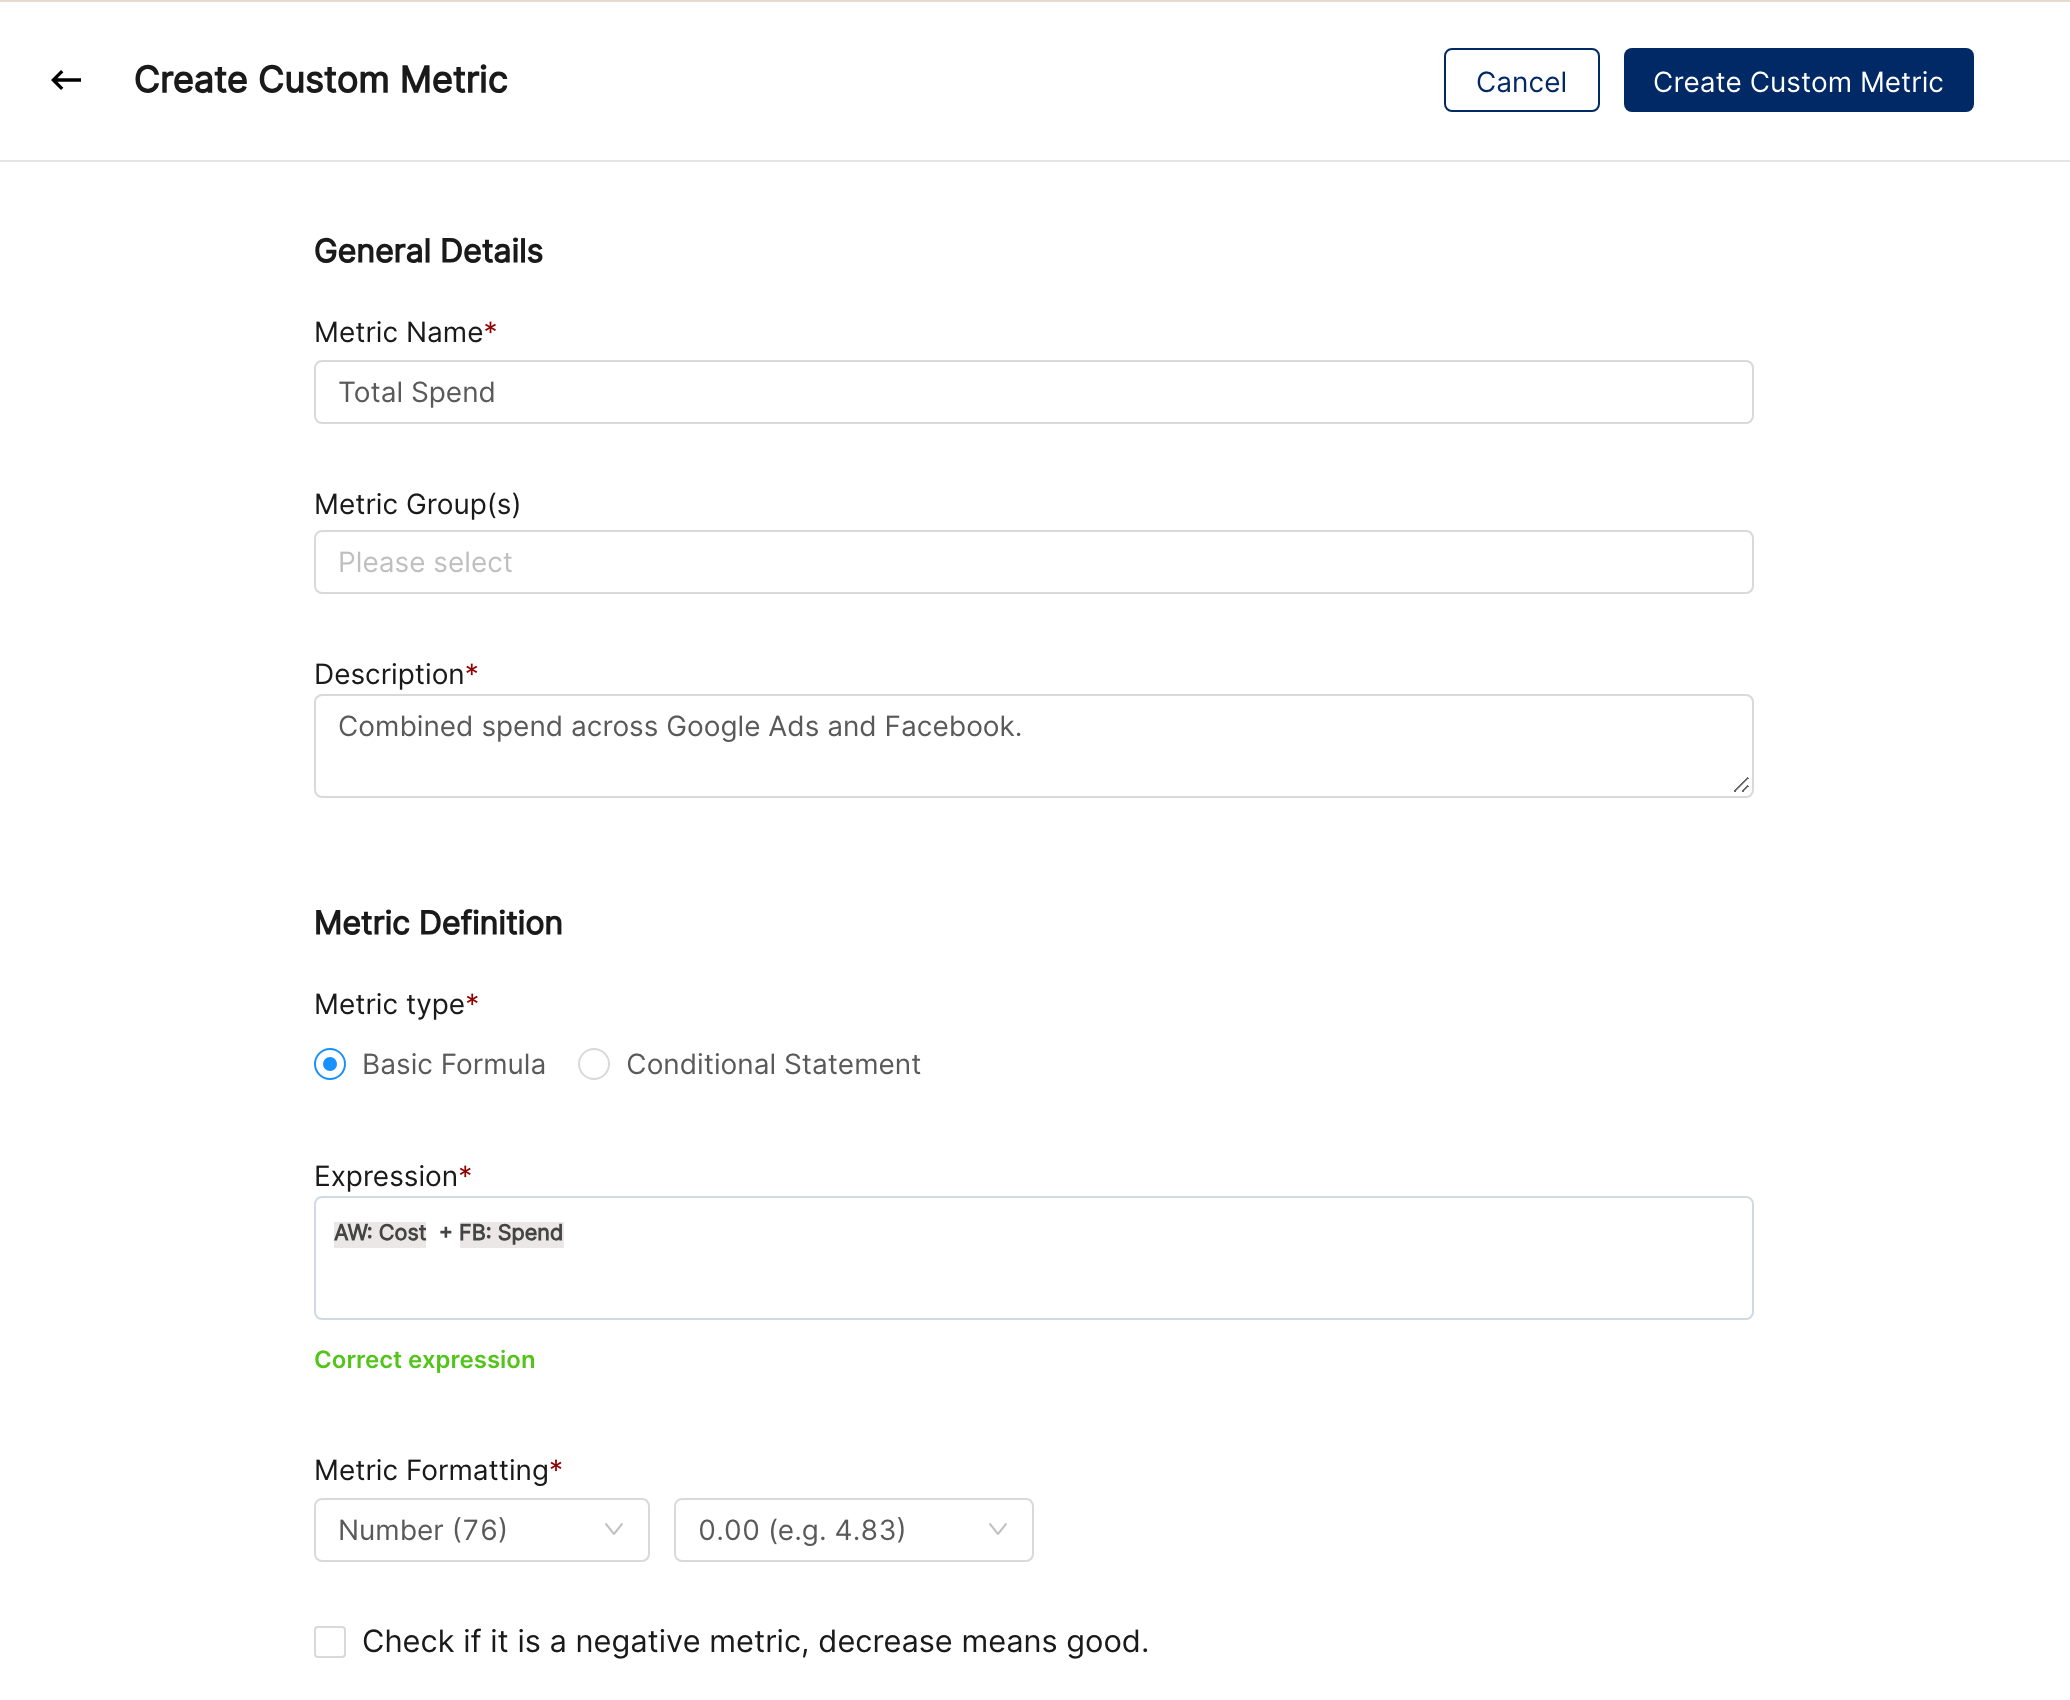
FB: Spendis a system metric for spend reported by Facebook, imported through the Facebook Ads API.Custom metrics are created by users on top of the data that comes in from an external source. Editors or Admins can create custom metrics that combine data points from different sources in a single column.
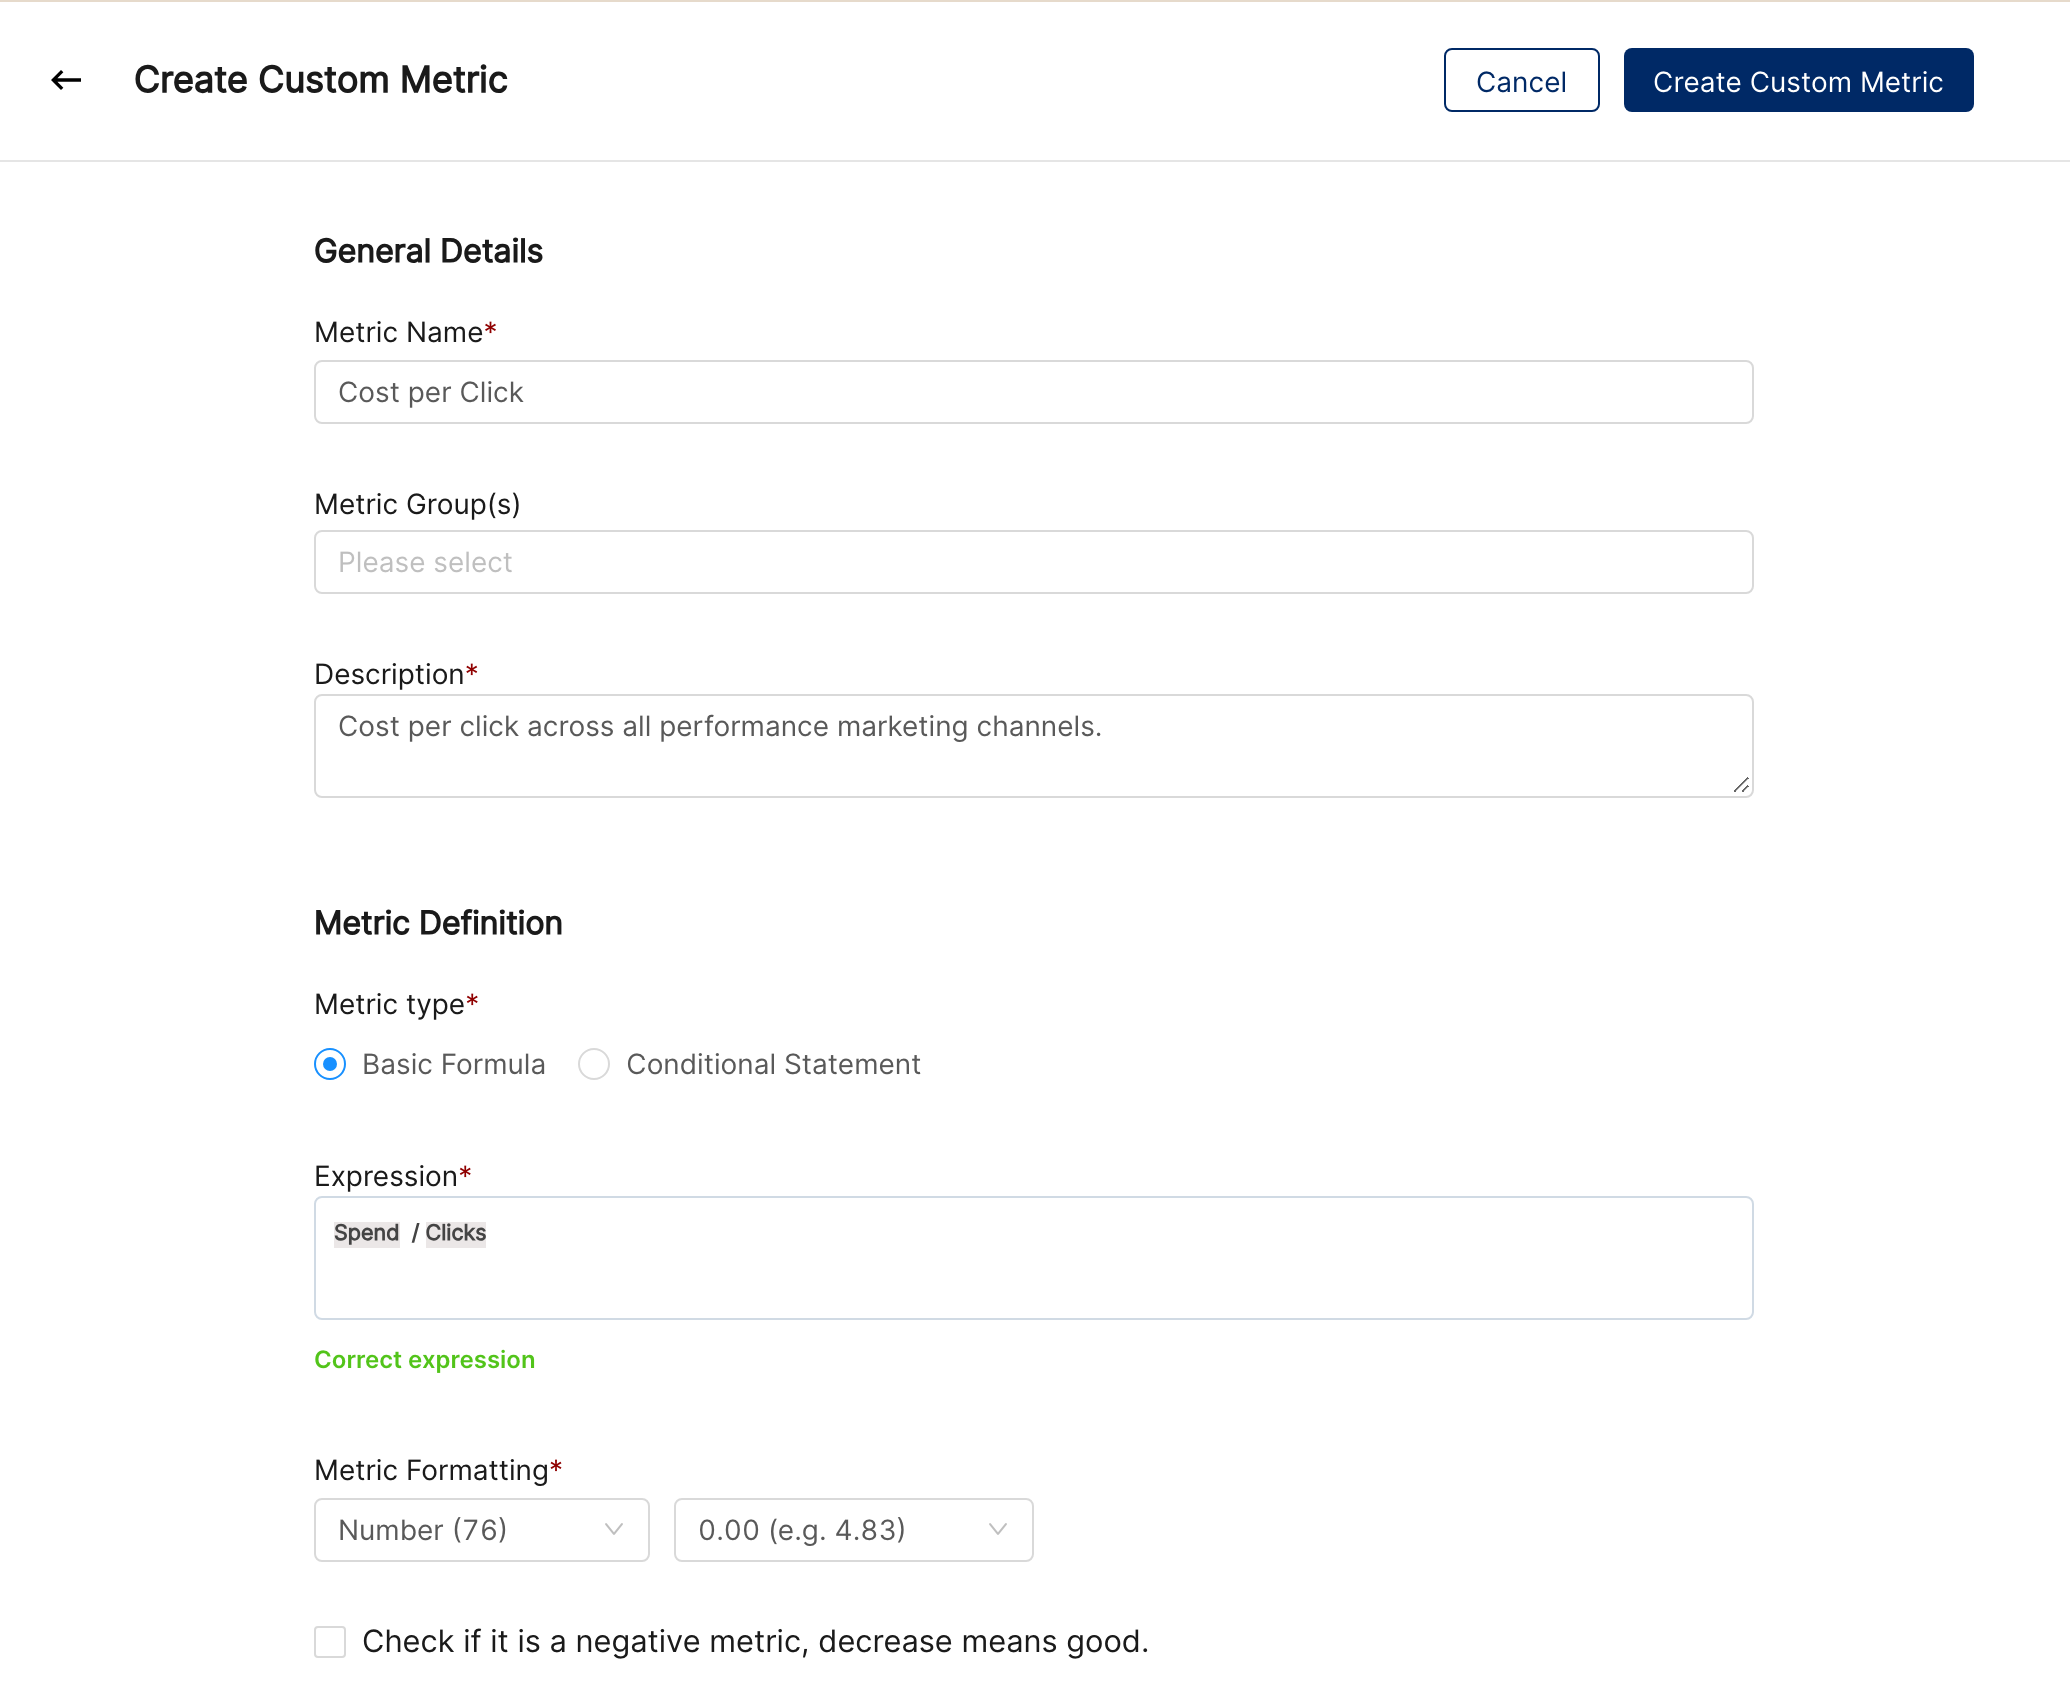
Custom metrics can also do calculations with system or custom metrics. For example, to measure Cost per Click across all your performance marketing data, admins can create a custom metric for it.
Data Sources
All system dimensions and metrics come from the data sources that Clarisights connects to. Whether you use existing reports or create new ones, you'll come across data sources. When they're used to create reports, they're called report segments.
There are two types of report segments:
Native segments: unfiltered, and contain all the information in the data source. Examples include Facebook Ads and Google Ads.
Custom segments: groups of several native segments, usually filtered to a subset of the information from those sources. Admins curate them for your workspace.
If your organization has curated report segments, we recommend using them. You can also ask the admins in your organization to create report segments for frequently used data sources and filter combinations. See Report Segments in Clarisights for details and how to create them.
For advanced use cases, and to explore unfiltered data from each data source, use native segments in your reports. For the integrations and all the dimensions and metrics imported into Clarisights, see Managing Metrics and Dimensions in Clarisights.
In the next article, we use dimensions and metrics in widgets to report on and explore data in existing reports.
Go to next article