
Using widgets in a Clarisights report
Now that you're familiar with the building blocks of Clarisights reports, this article shows how to use them to explore data in reports.
Widgets
Every report in Clarisights contains widgets, which come in several types. Below is an example of a timeline chart widget. It lets you quickly change the time grouping to view trends by day, week, quarter, year and so on.
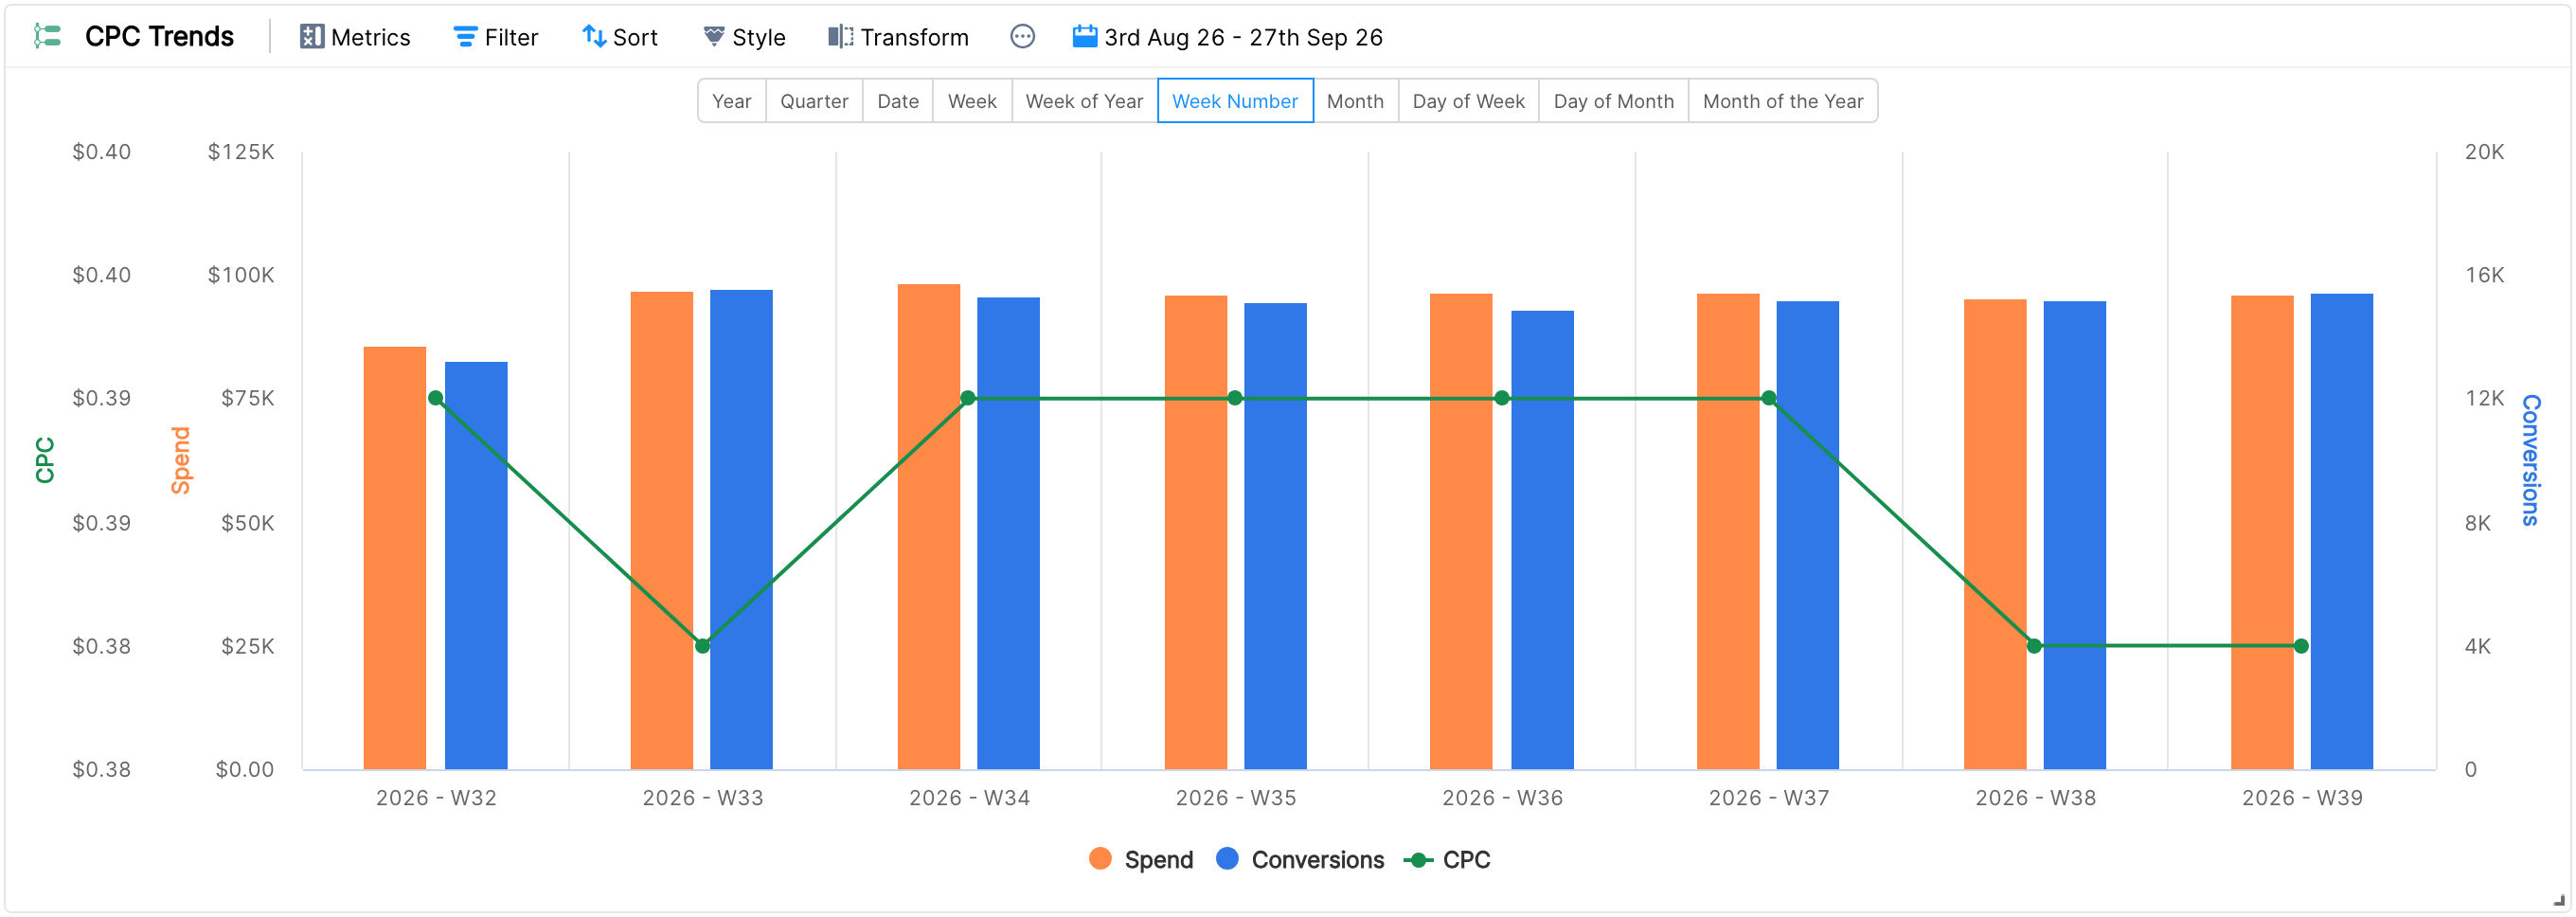
Each widget has a few settings you can control from the panel at the top of the widget. Different widgets use dimensions and metrics in different ways to create charts.

These small buttons are powerful: they let you work with your data and bring out insights to present. You can use them both to explore data in existing reports and to create new reports. The basic functions are covered below.
Action buttons in widgets
Dimensions & Metrics: select one or more primary dimensions and metrics for the widget, from system or custom fields. The list is grouped by the data sources selected in the report, plus a single group of custom dimensions or metrics. Clarisights rolls up the metric data to the dimensions you've selected, much like a pivot in a spreadsheet.
Breakdowns: the Breakdowns section in the Dimensions panel lets you break down the information you're looking at by another dimension. You can use almost any dimension as a breakdown, as long as it is compatible with the dataset you're exploring. Breakdowns are available only in some widget types, such as Table, Pivot Table, Breakdown chart and Stacked Chart.
Filters: narrow down the scope of your analysis by dimension or metric. Use filters to include what you need, or exclude what you don't, in the widget. A filter combines a dimension, an operator and a value. For example, Campaign contains "_RMA" keeps only the data for campaigns whose name contains "_RMA". You can also nest multiple filters in AND and OR conditions.
You can apply filters to an individual widget, or to all the widgets in a tab by adding them at tab level. Tab filters are combined with each widget's own filters in an AND condition.
Sorting: order the results in the widget, either ascending or descending by a metric, or alphabetically by dimension values. You can also sort breakdowns separately, with a different condition.
Style: change the row size in a table, show a metric as a line or as columns, and control colors in charts. You can also change the axes and scale of metrics.
Date Override: set a different date range for one widget. The widget then ignores the report's date picker and uses the override dates instead.
Transform: change a widget from one type to another. Different widget types may need different combinations of metrics and dimensions, so you may also need to adjust your selection for the new type.
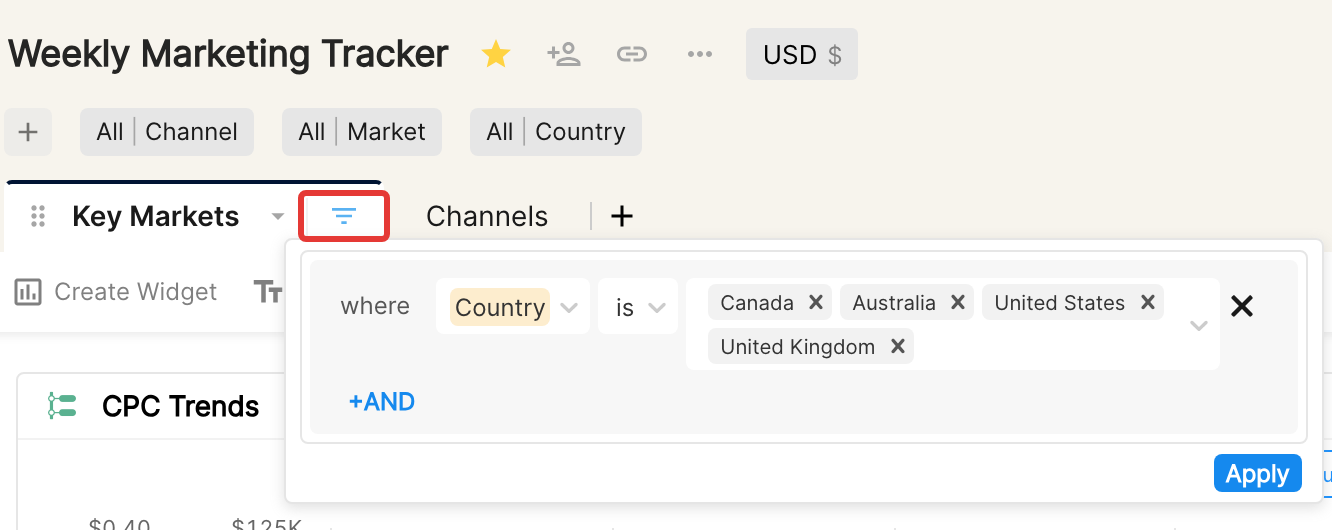
Table widget
The table widget is the most common widget type in Clarisights reports. It is versatile and can present a lot of information in a compact form. Watch the video below for a demo of the Table Chart.
Text widget
The text widget is the most different from the rest. Use it to add text to your report, for example:
Notes and highlights
Section dividers
Instructions on how to read the report
The text widget supports formatting such as headings, text colors, background colors, hyperlinks and even emojis. Use it to add context to your reports and make them easier for anyone in the organization to use.
In the next article in this series, we create a report in Clarisights using several types of widgets.
Go to next article